This project aims to map sites in district of Hope located in Fraser Valley Regional District (FVRD), British Columbia that have the highest priority for ecological restoration. All of FVRD’s environment is vulnerable to farming and growing development, therefore, needs protection as well as restoration for a sustainable future. Several organizations such as Fraser Valley Watershed Coalition are working towards the goal to restore and enhance FVRD’s ecology; however, there are no projects underway in Hope. I have used GIS and literature review to identify sites in Hope that have the potential to succeed in ecological restoration and would be the most efficient to implement. Though this project requires further studies as this topic is complex and requires systems thinking.
Author: sayena sadeghi
Introduction
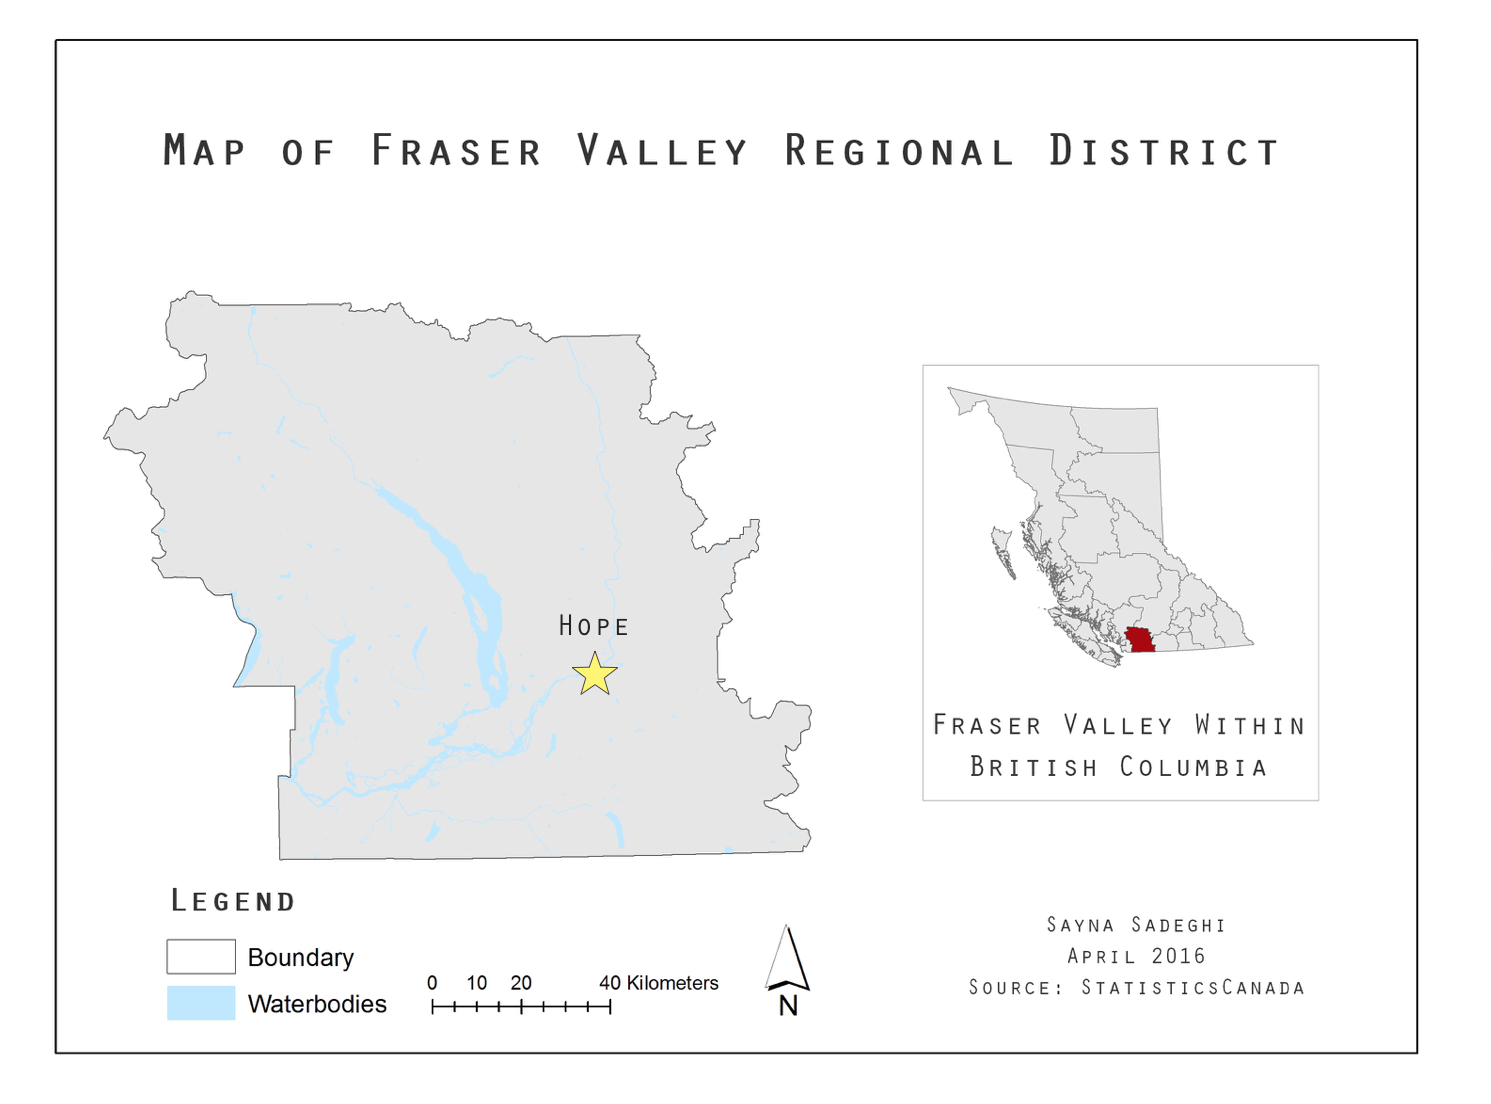
Where is Hope?
Hope is a district municipality located at the eastern end of both Fraser Valley and Lower Mainland region in British Columbia, Canada (Map 1) and is situated at the junction of two important rivers: Fraser and Coquihalla (District of Hope, n.d.). Additionally, there are Silverhope Creek, Kawkawa Lake, and many other streams that are part of a larger ecosystem, which is home to birds, fish and other wildlife (District of Hope, 2014). Hope is no exception to the widespread concern of environmental degradation in Fraser Valley due to development, urbanization and agriculture. Its environment requires protection as well as ecological restoration for a sustainable future (FVWC, n.d.).
Why Hope?
Ecological restoration is defined as “an intentional activity that initiates or accelerates the recovery of an ecosystem with respect to its health, integrity and sustainability” (Society for Ecological Restoration International, 2004). An Official Community Plan (OCP) was written in September 2014 for District of Hope with the purpose to “provide objectives for different land uses to meet future needs for 5 to 10 year period” (District of Hope, 2014). A thorough OCP should include plans regarding preservation, protection, restoration and enhancement of the natural environment and ecosystems (Here’s a video with more information on OCPs) (District of Hope, 2014). Although Hope’s OCP includes a section on plans for the environment, it does not include any restoration efforts.
Considering that Fraser Valley’s environment is degrading and that this plan is for the next 5 to 10 years, the OCP should include restoration plans. Hope has pledged to reduce Greenhouse Gas emissions 23% per capita below 2009 levels by 2030 as a part of the Province of British Columbia’s Climate Action Initiative (District of Hope, 2014). Ecological restoration would contribute to this plan as recovery of deforested and degraded environments could be essential in the fight against global warming as plants absorb and store carbon in their trees and soil (WWF, n.d.). Additionally, much of Hope is at the risk of natural hazards including flood hazards (District of Hope, 2014). Many studies suggest that ecologically restored landscapes could mitigate such disasters and it is more cost-effective and sustainable than traditional methods like dams and levees (Fiksel, 2006).
Where do I come in?
Therefore, for this project, I map the potential ecological restoration sites in the district of hope that are of highest priority using the Restoration Prioritization and Prediction Model (RePP from a study by Lane et al., 2008). This project hopes to be some kind of assistance regarding Hope’s Official Community Plan as well as similar cases.
Methodology
For prioritization of restoration sites in Hope, first I created 2 criteria, each including sub-criterions, primarily using Lane et al. (2008) paper and considering data available. The first criteria focuses on prioritizing sites with high probability of restoration success and the second concentrates on prioritization of sites that would have highest restoration efficiency. After creating separate maps for each sub-criterion, I conducted a Boolean Multi Criteria Evaluation (MCE) for criterion one due to categorical nature of my data. Then, I reclassified the slope layer I created (from a contour layer) appropriately for criterion two (see flowcharts here). Here are my criteria including their logic and data sources:
1) Prioritizing sites with high probability of restoration success
Restoration is more likely to be successful in areas that are not exposed to threats or stressors such as human disturbances. Therefore, areas with the least threats / stressors were ranked highest and used for mapping highest priority sites. The report (Lane et al., 2008) provides rankings for each of the below sub-criteria, which used to map the highest ranked conditions. Each sub-criterion fits one of the categories of ‘constraint’ or ‘factor’ for the Multi Criteria Evaluation (MCE). The constraints are taken out of the final map and the factors are used to map the sites.
Factors:
- Areas with minimal human disturbance
I omitted areas that are highly impervious for this section since a high percentage of impervious cover is often associated with excess heat, trampling, salt, sand, snow damage etc. I erased categories of ‘poor’ and ‘very poor’ from soil drainage data. Data: Soil Drainage shape file from HectaresBC
- Surface Material
Restoration is only possible in sites with organic or mineral soil (no rock). Therefore, I will identify and add these areas to the map. Data: Surface Material from HectaresBC
Constraints:
- Salt / spray runoff
Salt spray and/or run off could threaten plant survival. Ranks of threat of salt spray are based on proximity to different road types. High traffic roads (4 lane or more) were buffered for 600 feet in either side and low/medium traffic roads (3 lane or less) were buffered for 120 feet for least threat scenario. Data: Roads in TRIM
- Railroad
Areas that are under ‘active’ railroad corridors will be subjected to maintenance; thus are not ideal for restoration. To separate ‘active’ railroads for the project, I erased ‘abandoned rail lines’ from the layer. Then, buffered ‘active’ railroads for 300 feet for lowest threat/stressor. Data: Rail lines in TRIM
- Utilities, buildings, industrial area etc.
Similarly, areas in vicinity of utilities, building etc. are subject to maintenance and human disturbance. Therefore, like railroads, utilities were buffered for 300 feet. Although for this sub-criterion I went through all the different classes and types of utilities and industries and found one type, ‘abandoned site’ under the class ‘extraction site’, that could undergo restoration since it’s not active anymore. Therefore, I omitted the buffers of these sites from the map. Additionally, I found this data as lines so I had to change some classes to polygons for buffering while I kept the appropriate classes as lines. Data: Utilities in TRIM
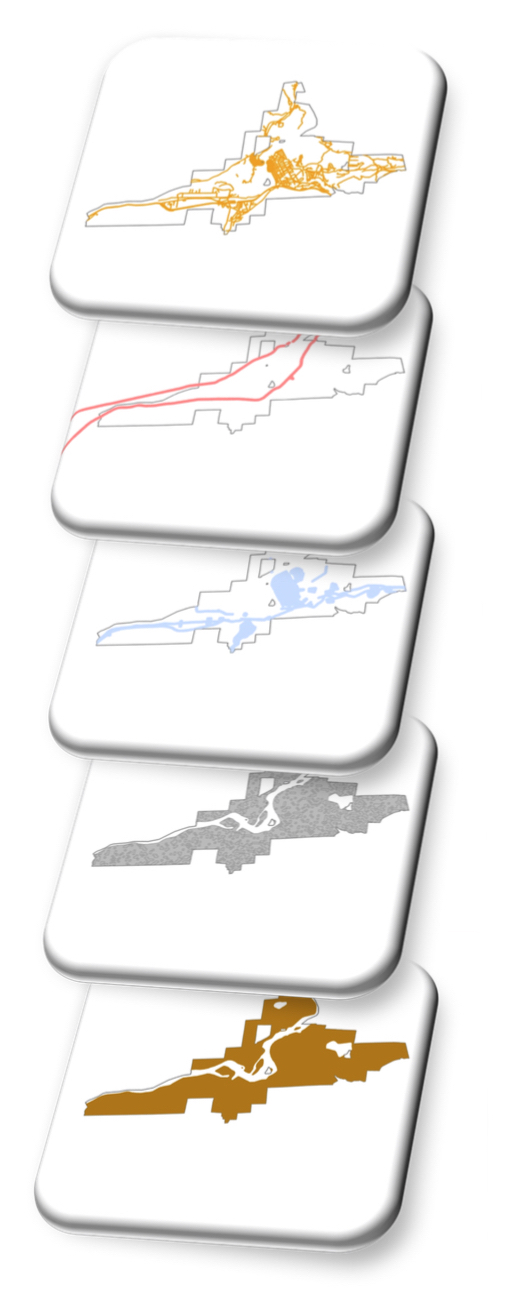
The figure below shows all my layers of constraints and factors before analysis.
2) Prioritizing restoration efficiency
Some polygons require less resources to implement and maintain restoration. These sites were prioritized and determined by slope of the site.
- Site slope
Restoration on steep slopes typically requires more resources for activities such as site preparation. Additionally, on steeper slopes the use of tractors and other machinery is usually difficult. Therefore, flatter slopes are prioritized in this project using reclassify tool. I identified slopes of higher than 10% with ‘NoData’ and reclassified slopes of 0-10% into for equal breaks for analysis. Since the availableDigital Elevation Models (DEM) had large pixel sizes, before reclassification, I created a TIN layer using contours, water lines and roads. I used ‘TIN to Raster’ tool to create a DEM following a Slope layer from DEM, which I used for this criteria. Data: Contours from GeoGratis
In the end, the criterion two layer was converted to vector data (using Raster to Polygon tool) and intersected with criterion one for further analysis and discussion.
Flowcharts
Criterion One – Prioritizing Sites with Highest Probability of Restoration Success

Criterion Two – Prioritizing Restoration Efficiency

Criterion One
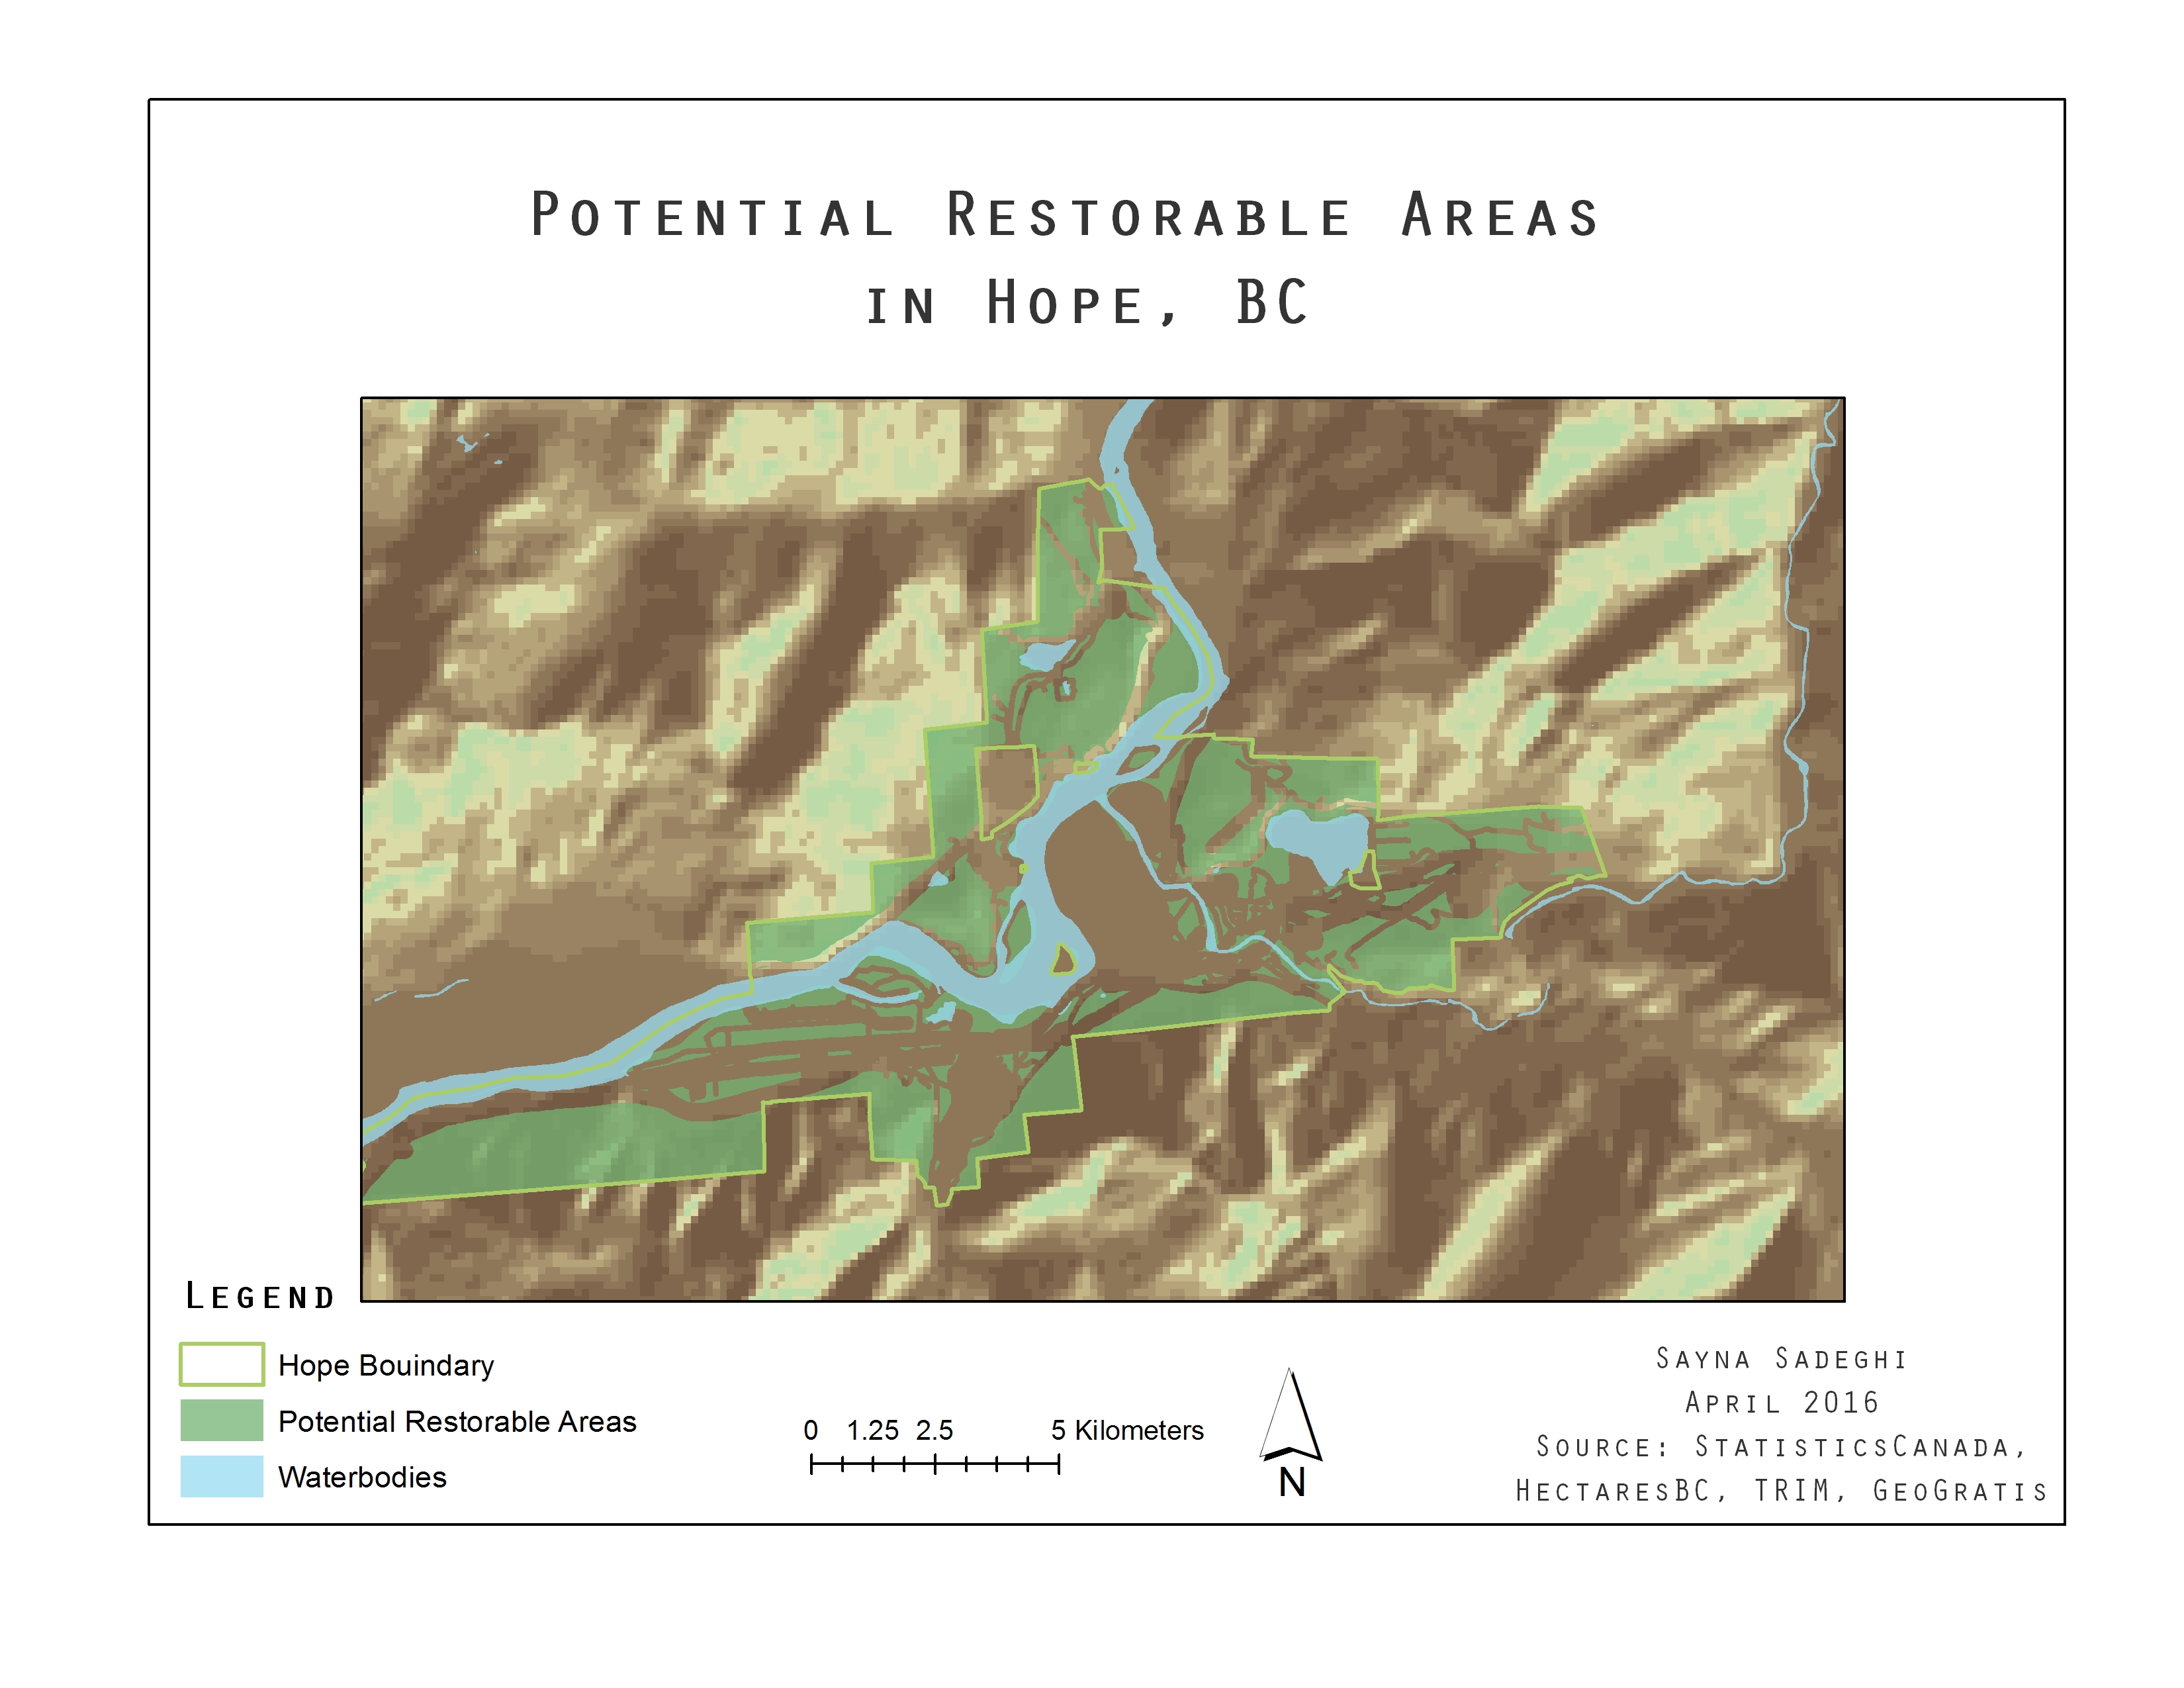
The final product of criterion one is Map 3. This map shows the areas that would have highest probability of success in case of restoration within the boundary of Hope in British Columbia on a ‘hillshade’ layer, which simulates sun rays over terrain.
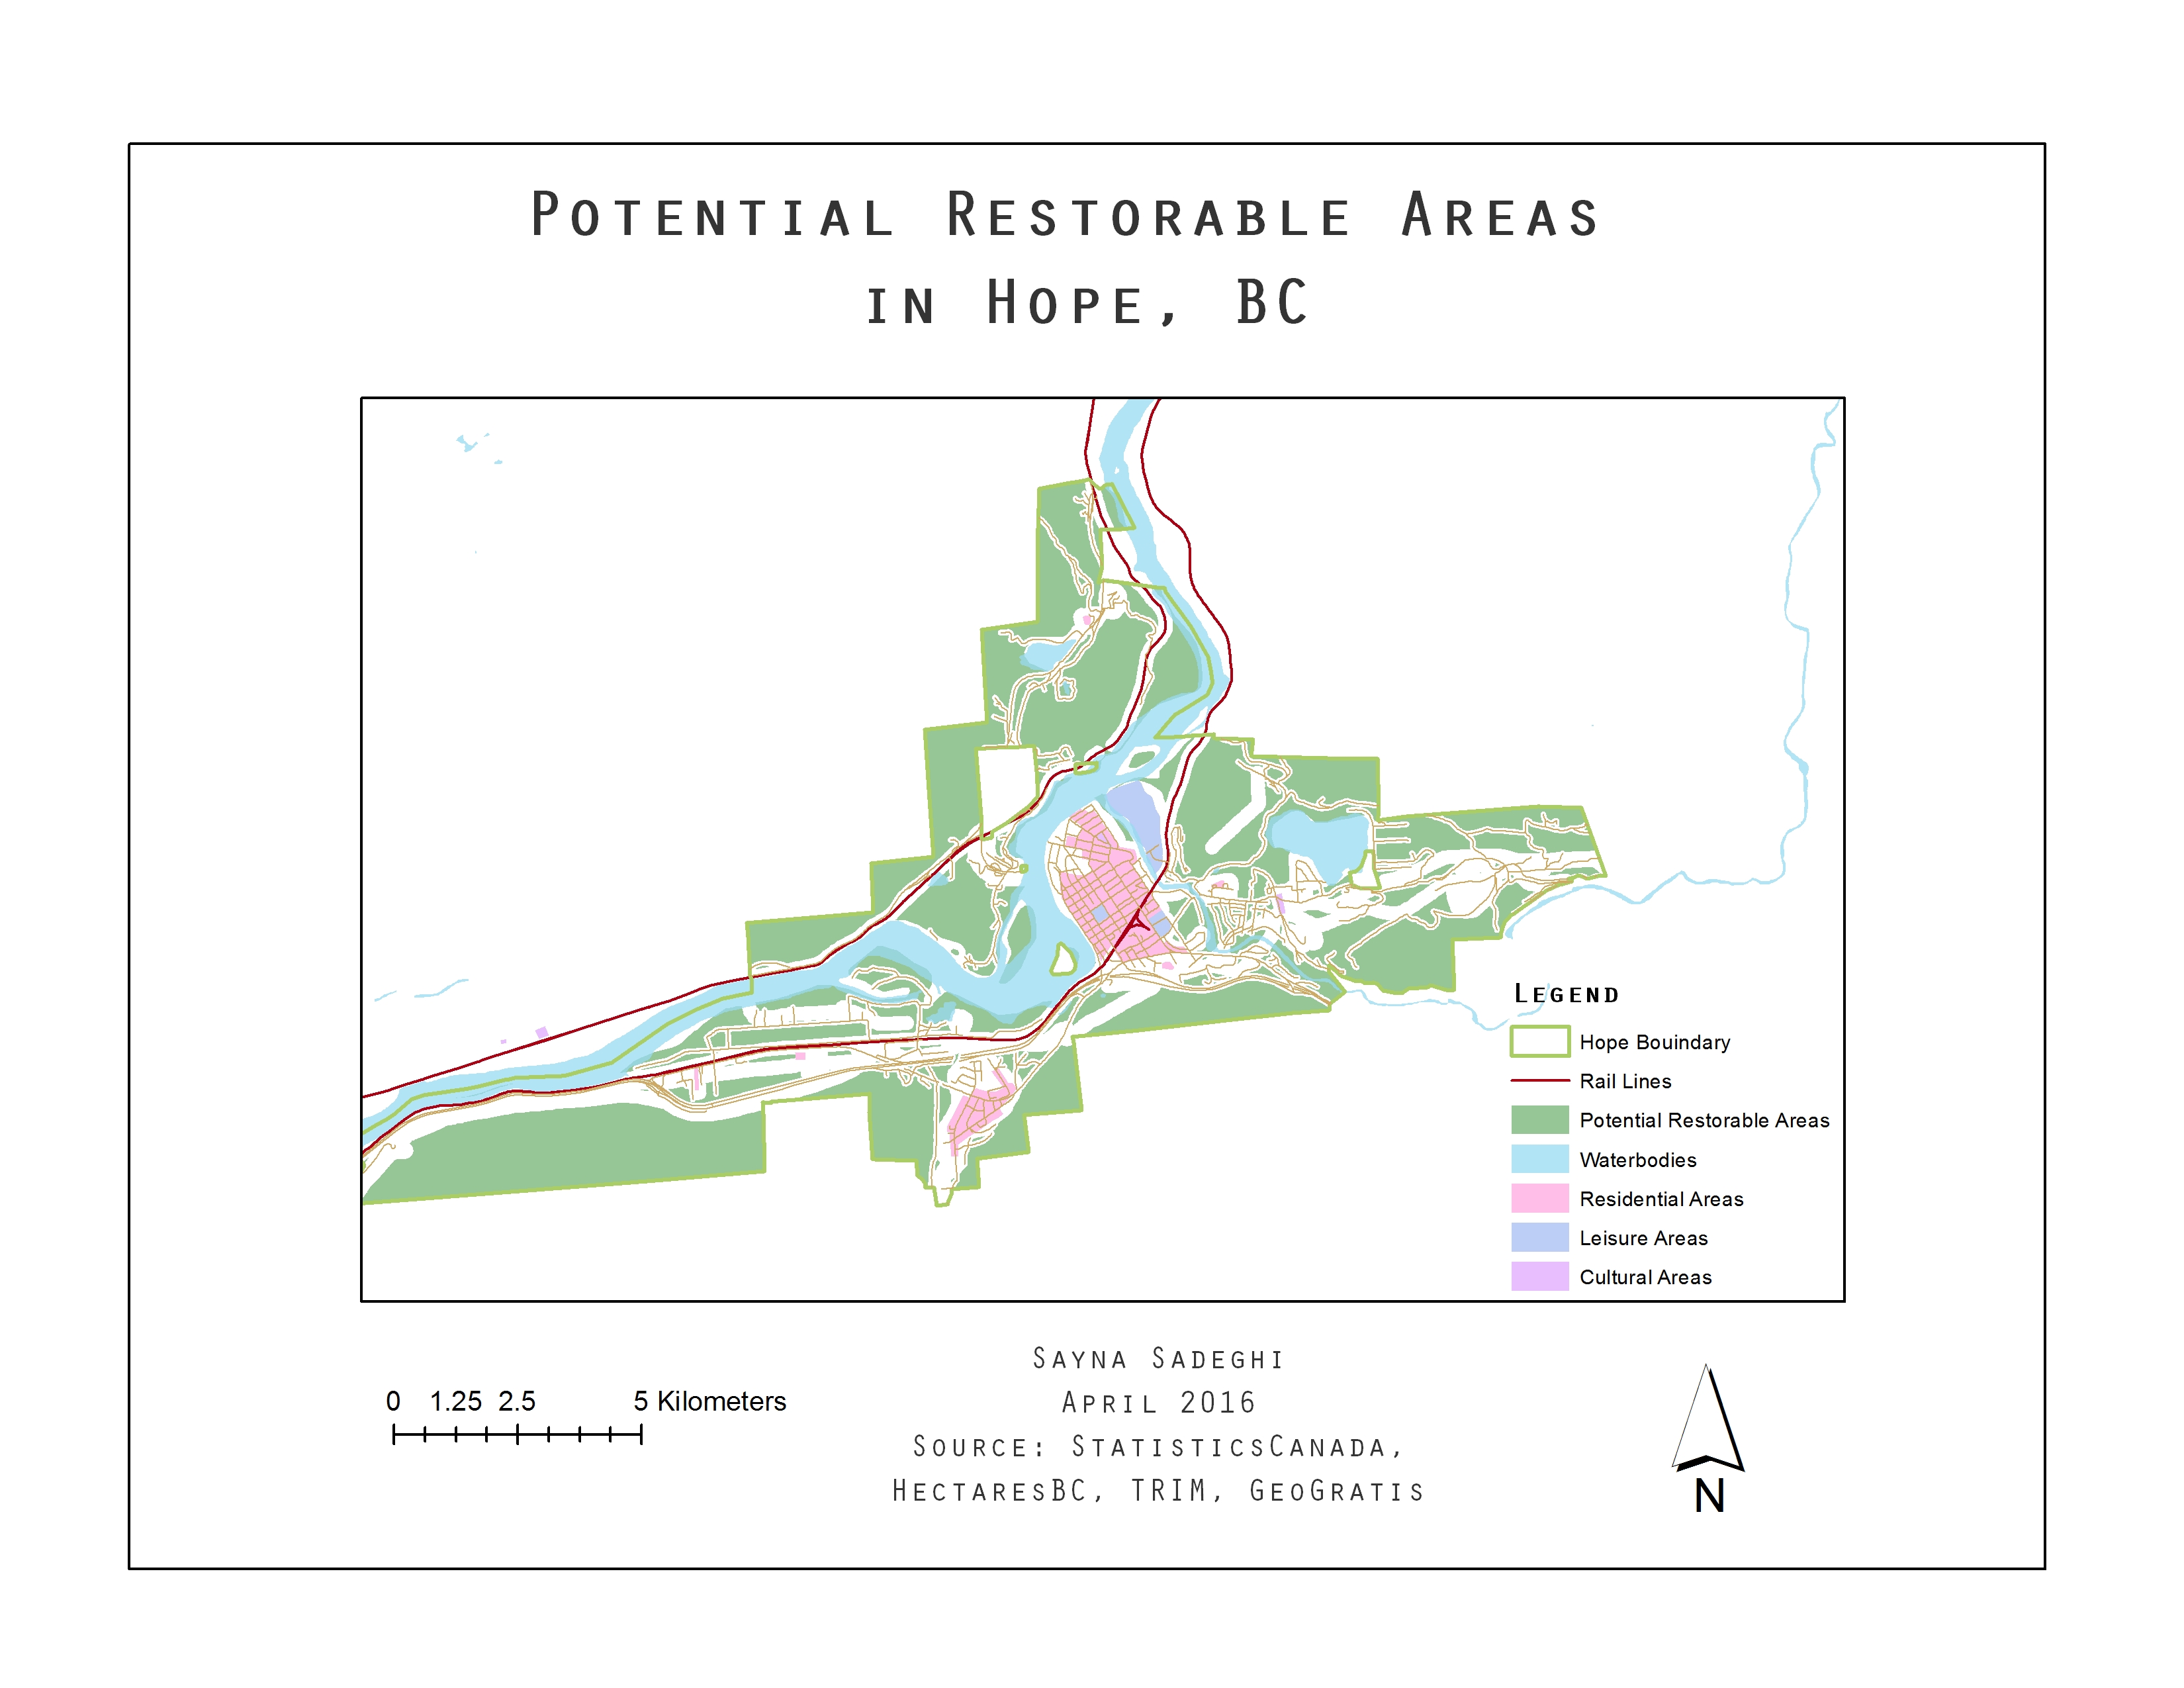
Map 4 also displays criterion one results within the land uses in the project area showing that the potential restorable areas do not intersect with any residential, cultural or leisure areas.
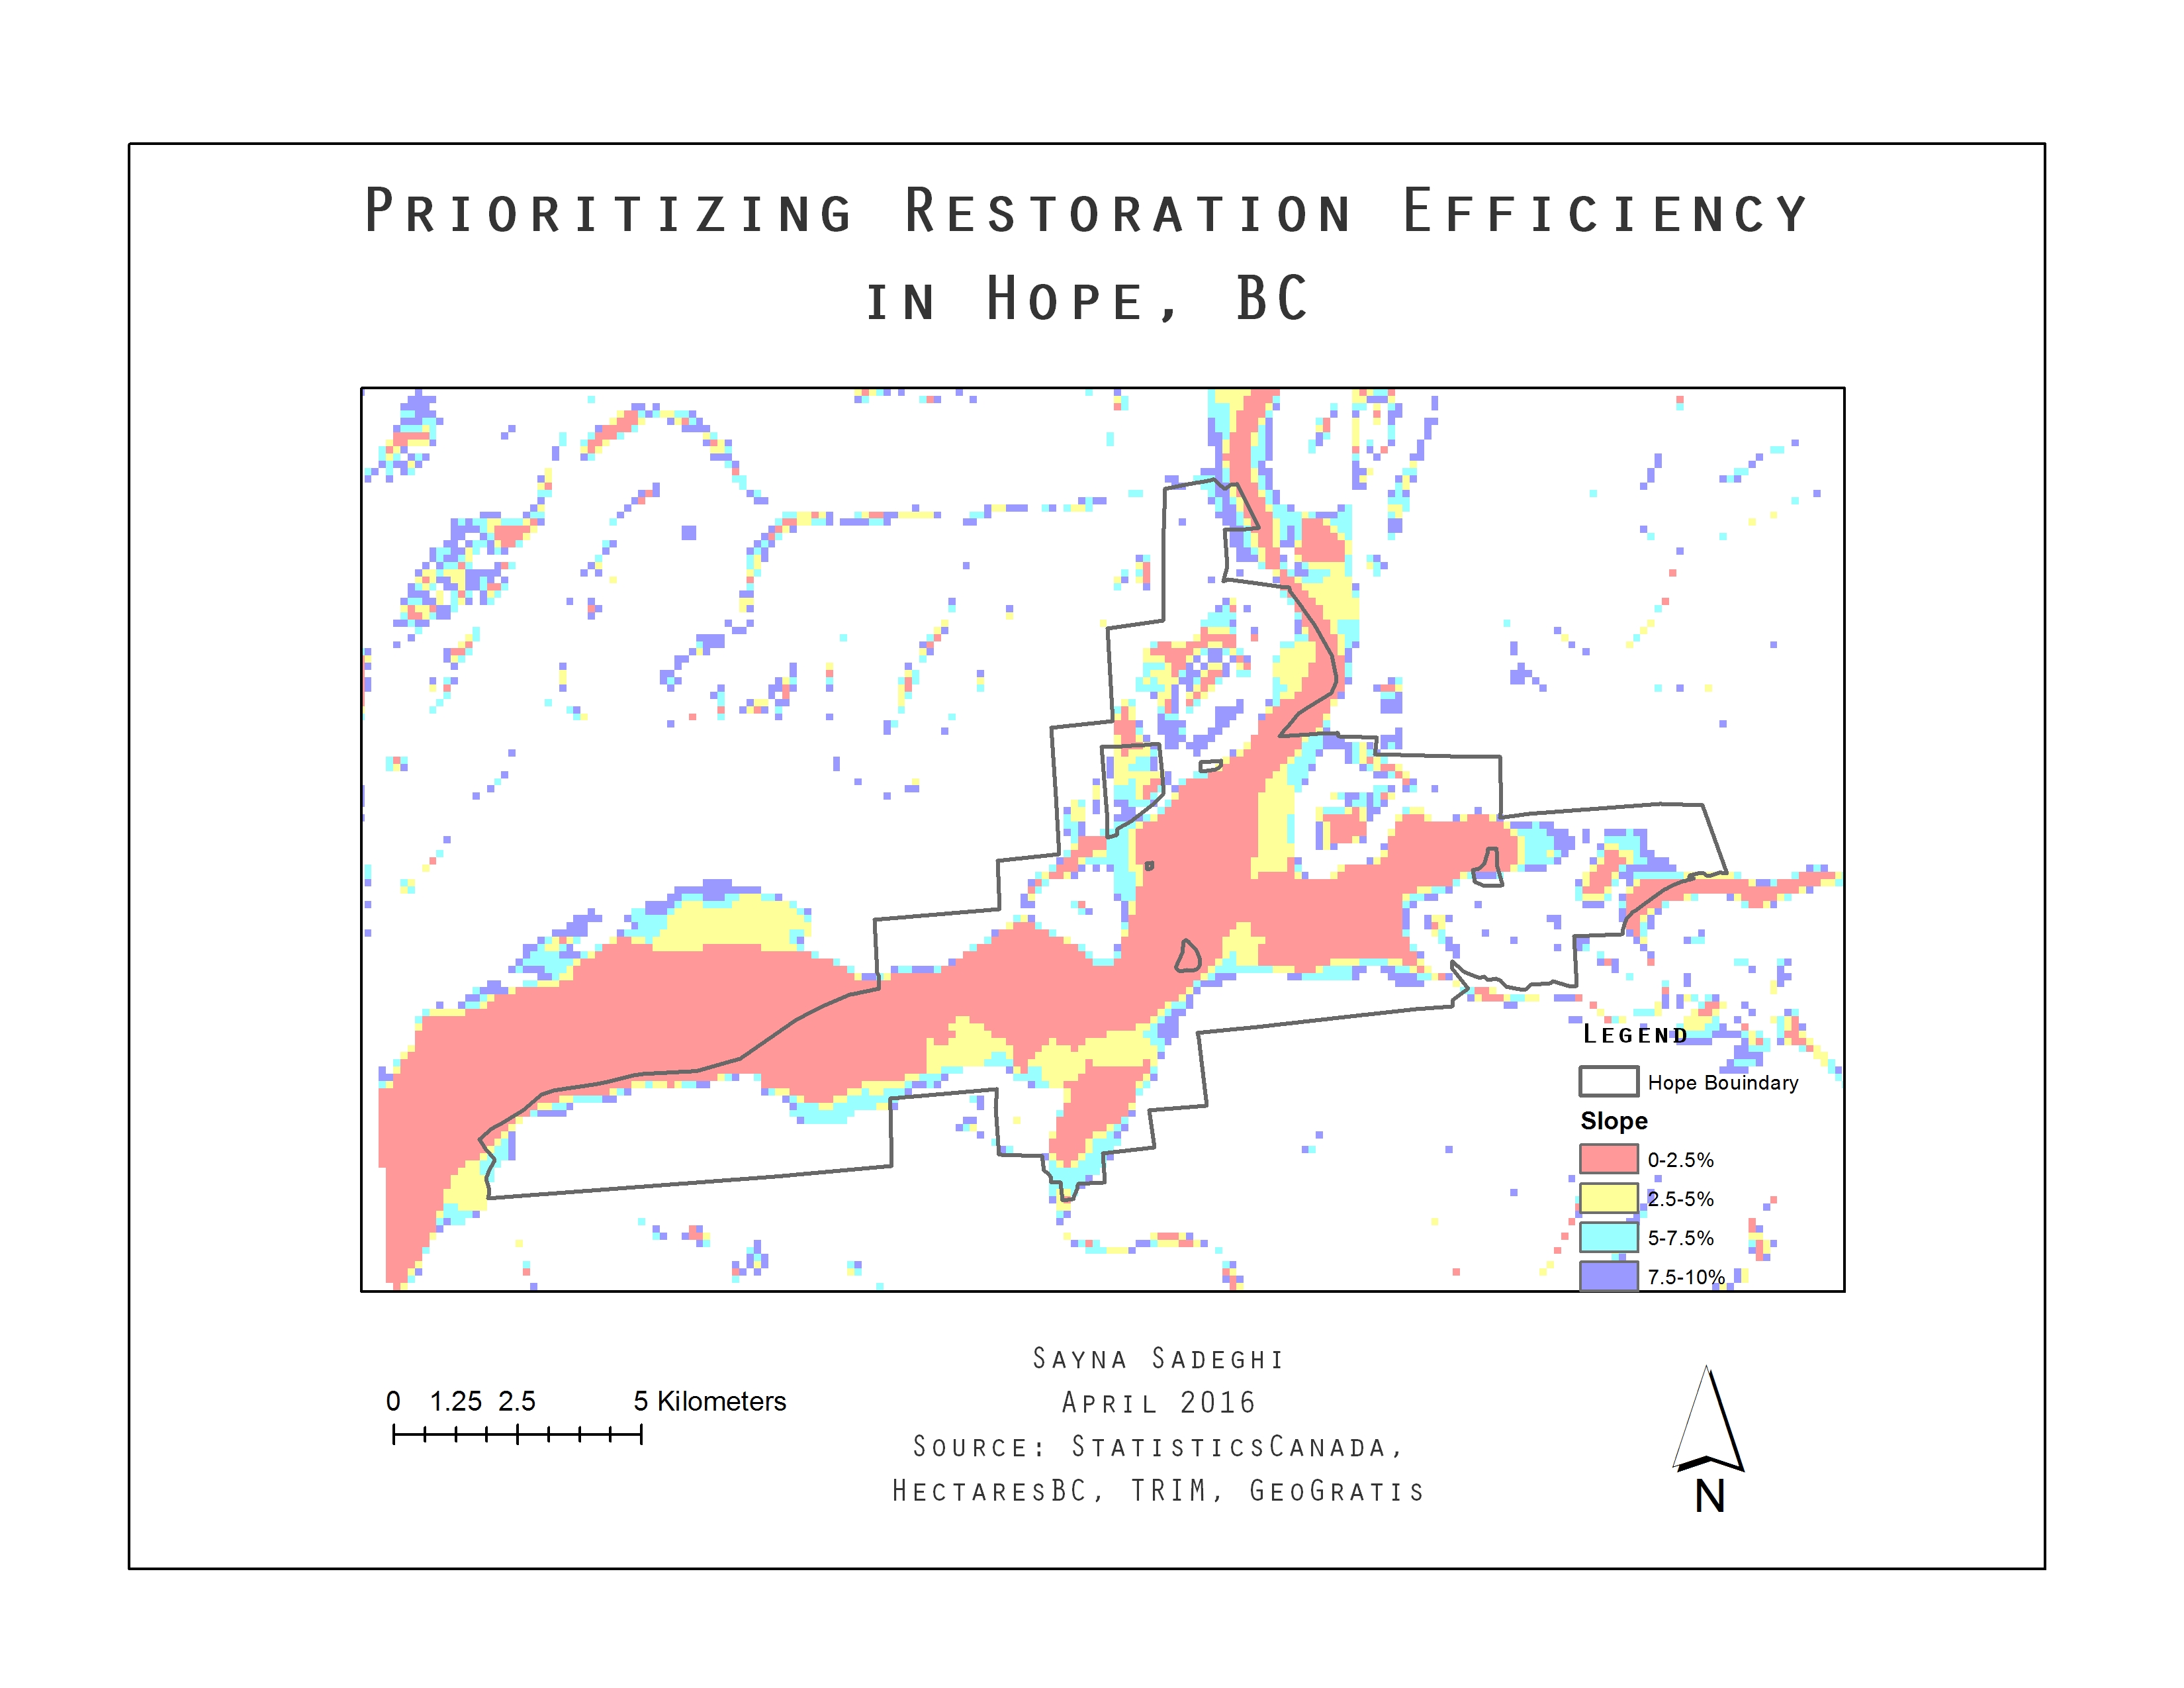
Criterion Two
Map 5 represents final product of criterion two. Areas with greater than 10% slope were omitted in this map as they do not provide sites that have the high levels of restoration efficiency. Lower slopes are more desirable in this map. Red areas are the most desirable and have slope of 0-2.5% as described in the legend.
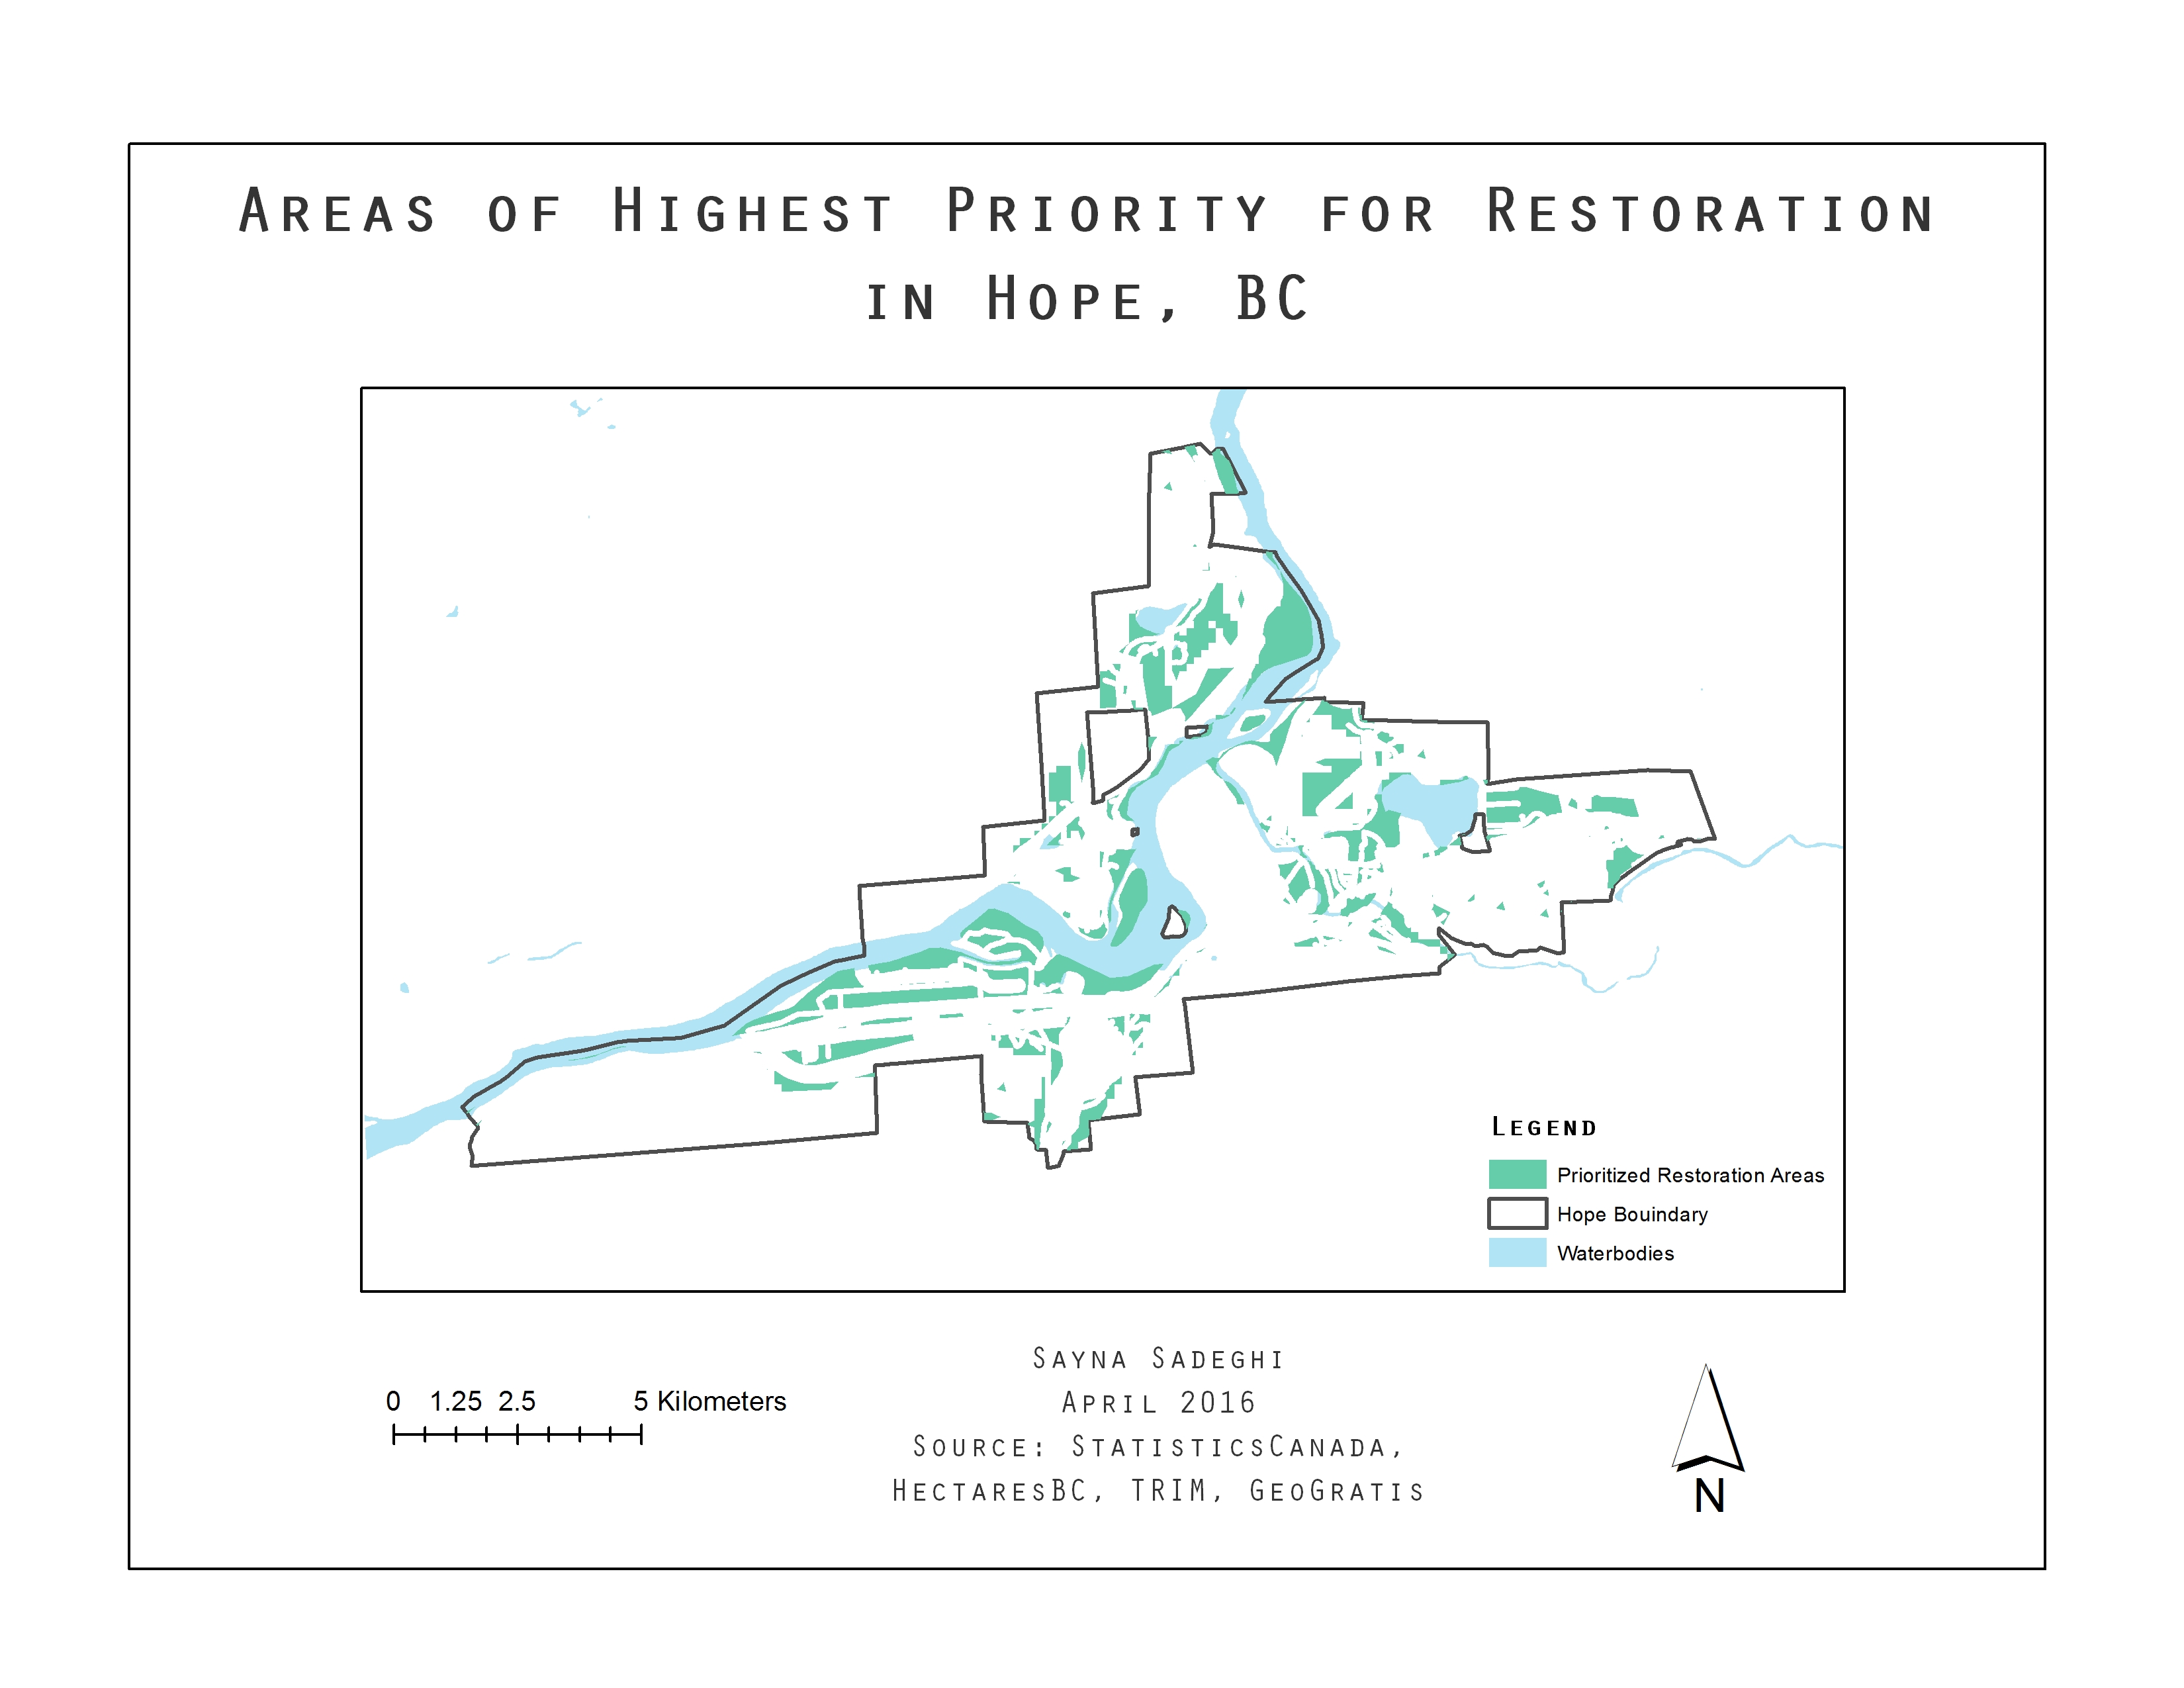
The intersect of criteria 1 and 2 areas indicates polygons that are of highest priority for restoration projects. Map 6 shows the results of this intersection. The green polygons show areas that have both highest probability of restoration success and highest levels of restoration efficiency. These areas total to 7,079,430.8 meter squared.
Criteria One and Two
The intersect of criteria 1 and 2 areas indicates polygons that are of highest priority for restoration projects. Map 6 shows the results of this intersection. The green polygons show areas that have both highest probability of restoration success and highest levels of restoration efficiency. These areas total to 7,079,430.8 meter squared.
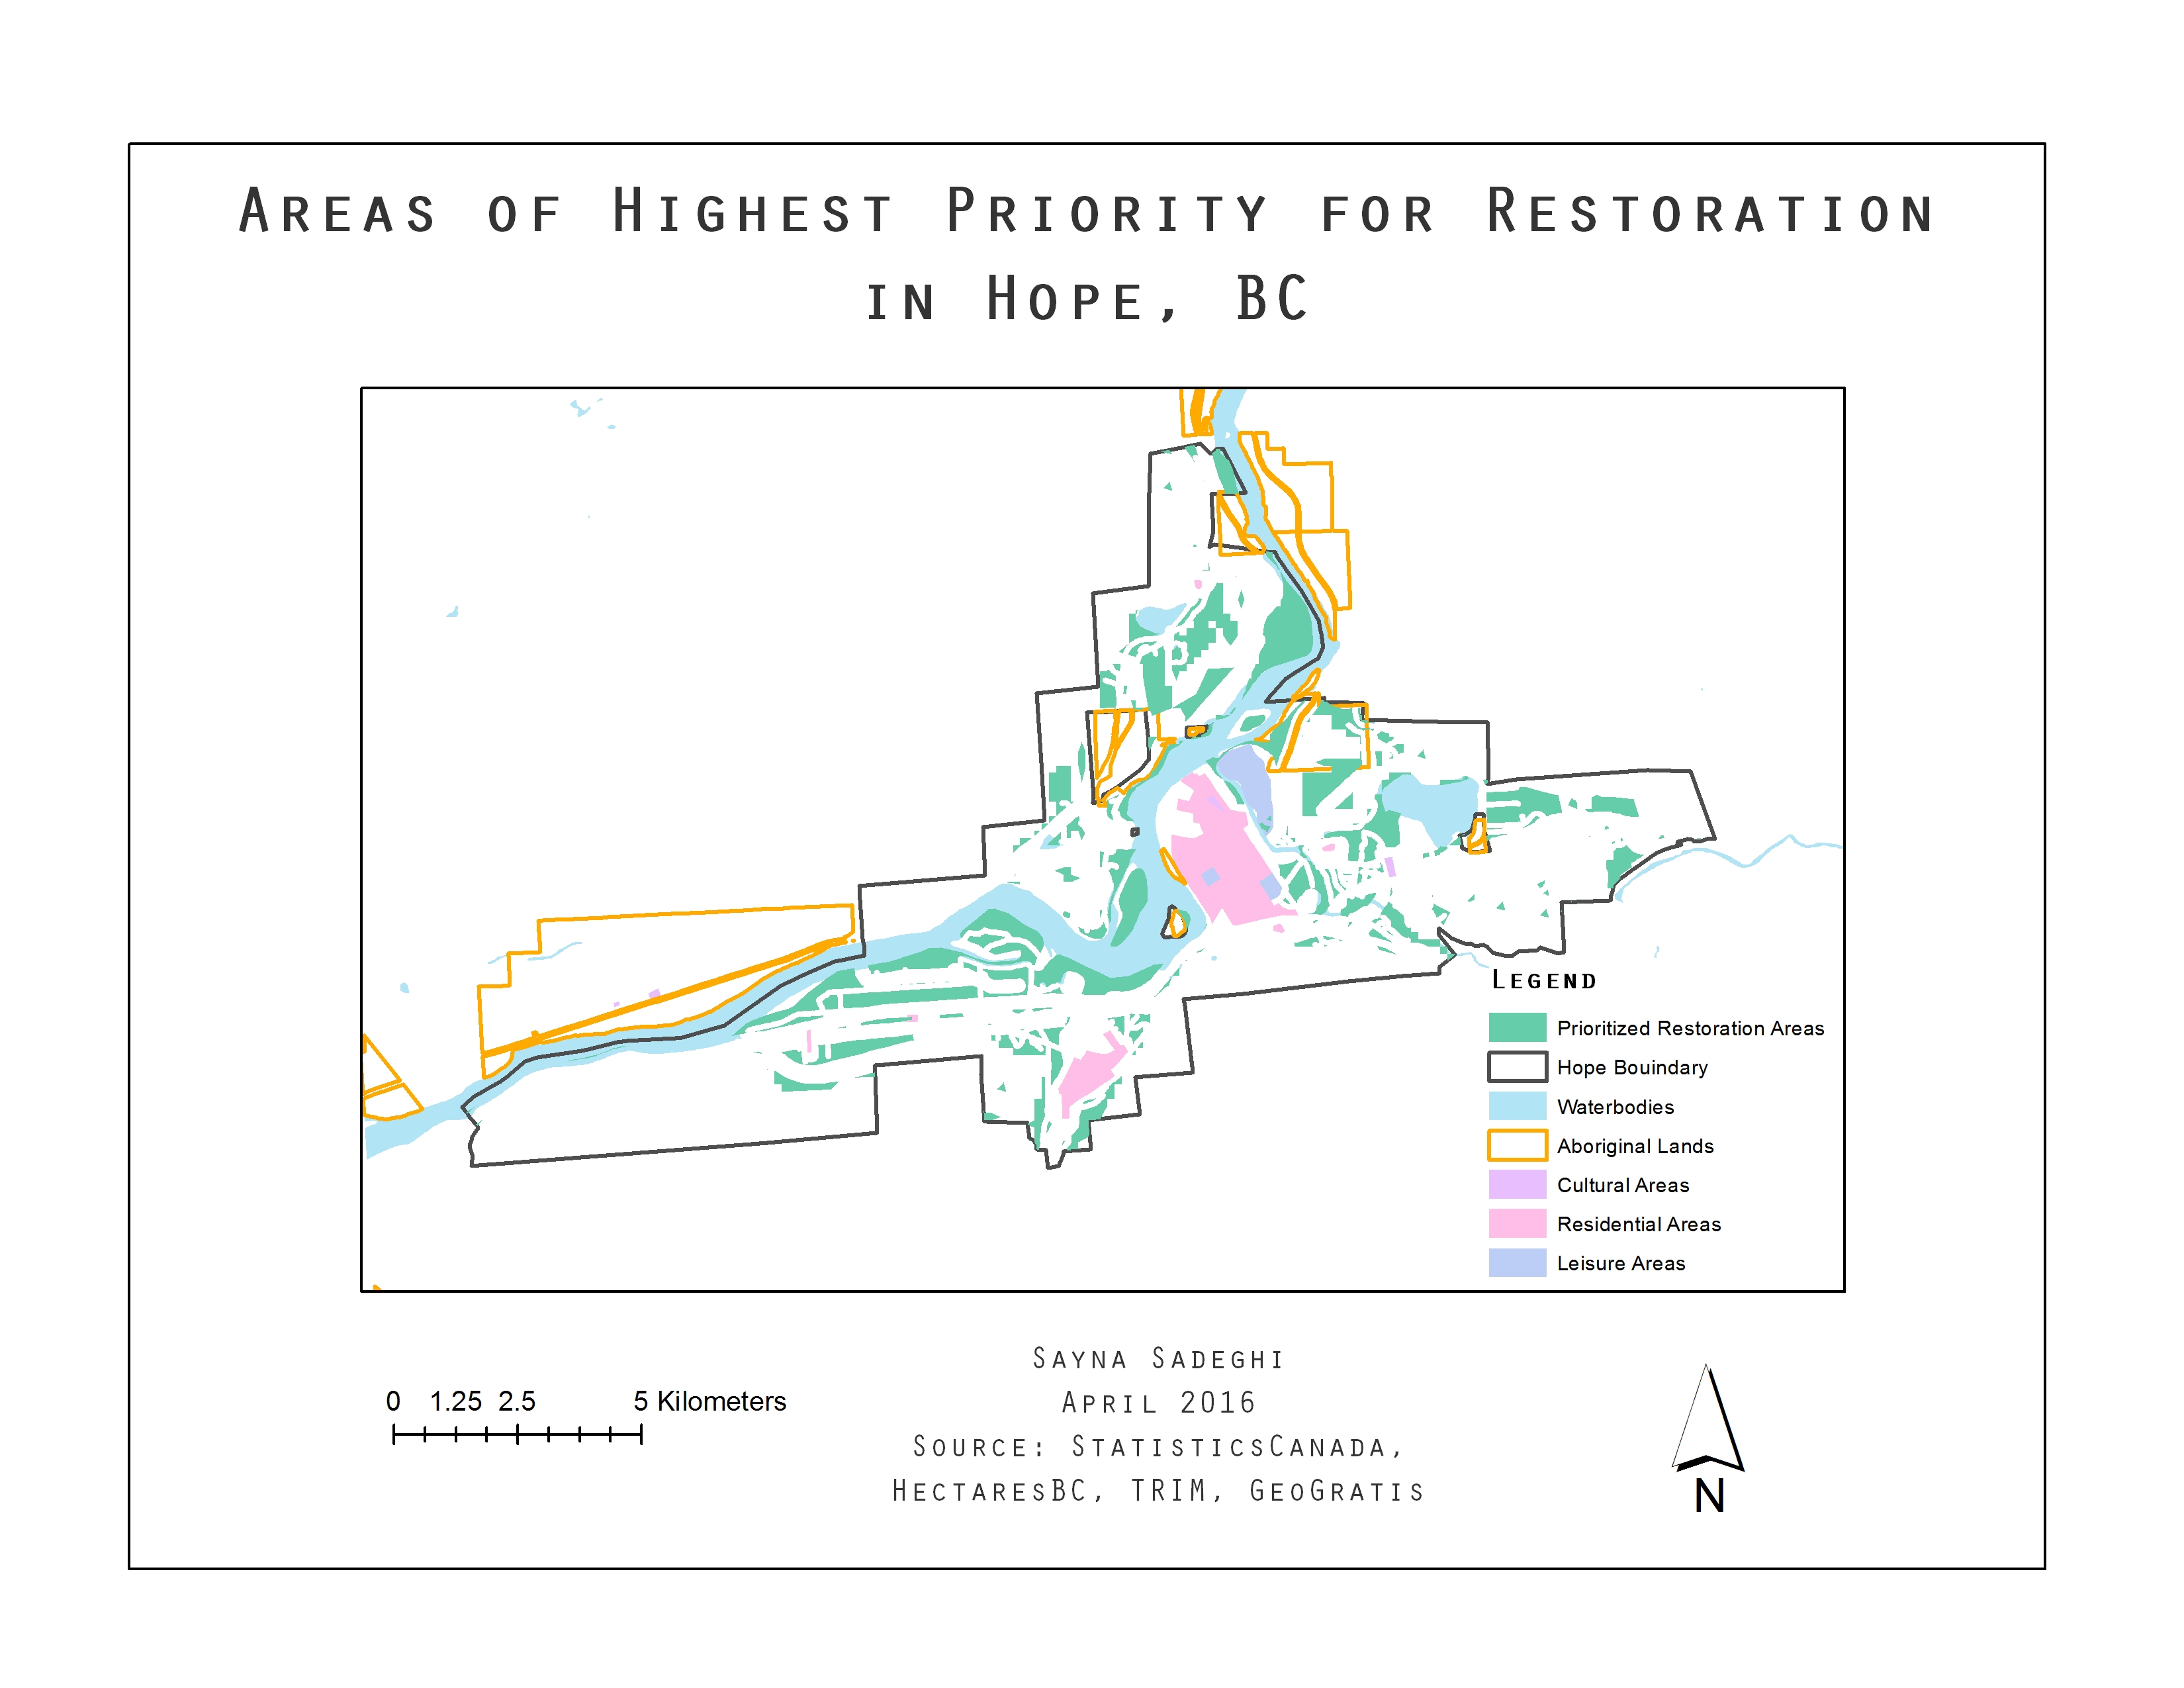
Looking at the land uses within these areas, the prioritized restoration areas barely overlap with residential, cultural and leisure ares as well as Aboriginal Lands, boundaries of which are shown in orange (Map 7).
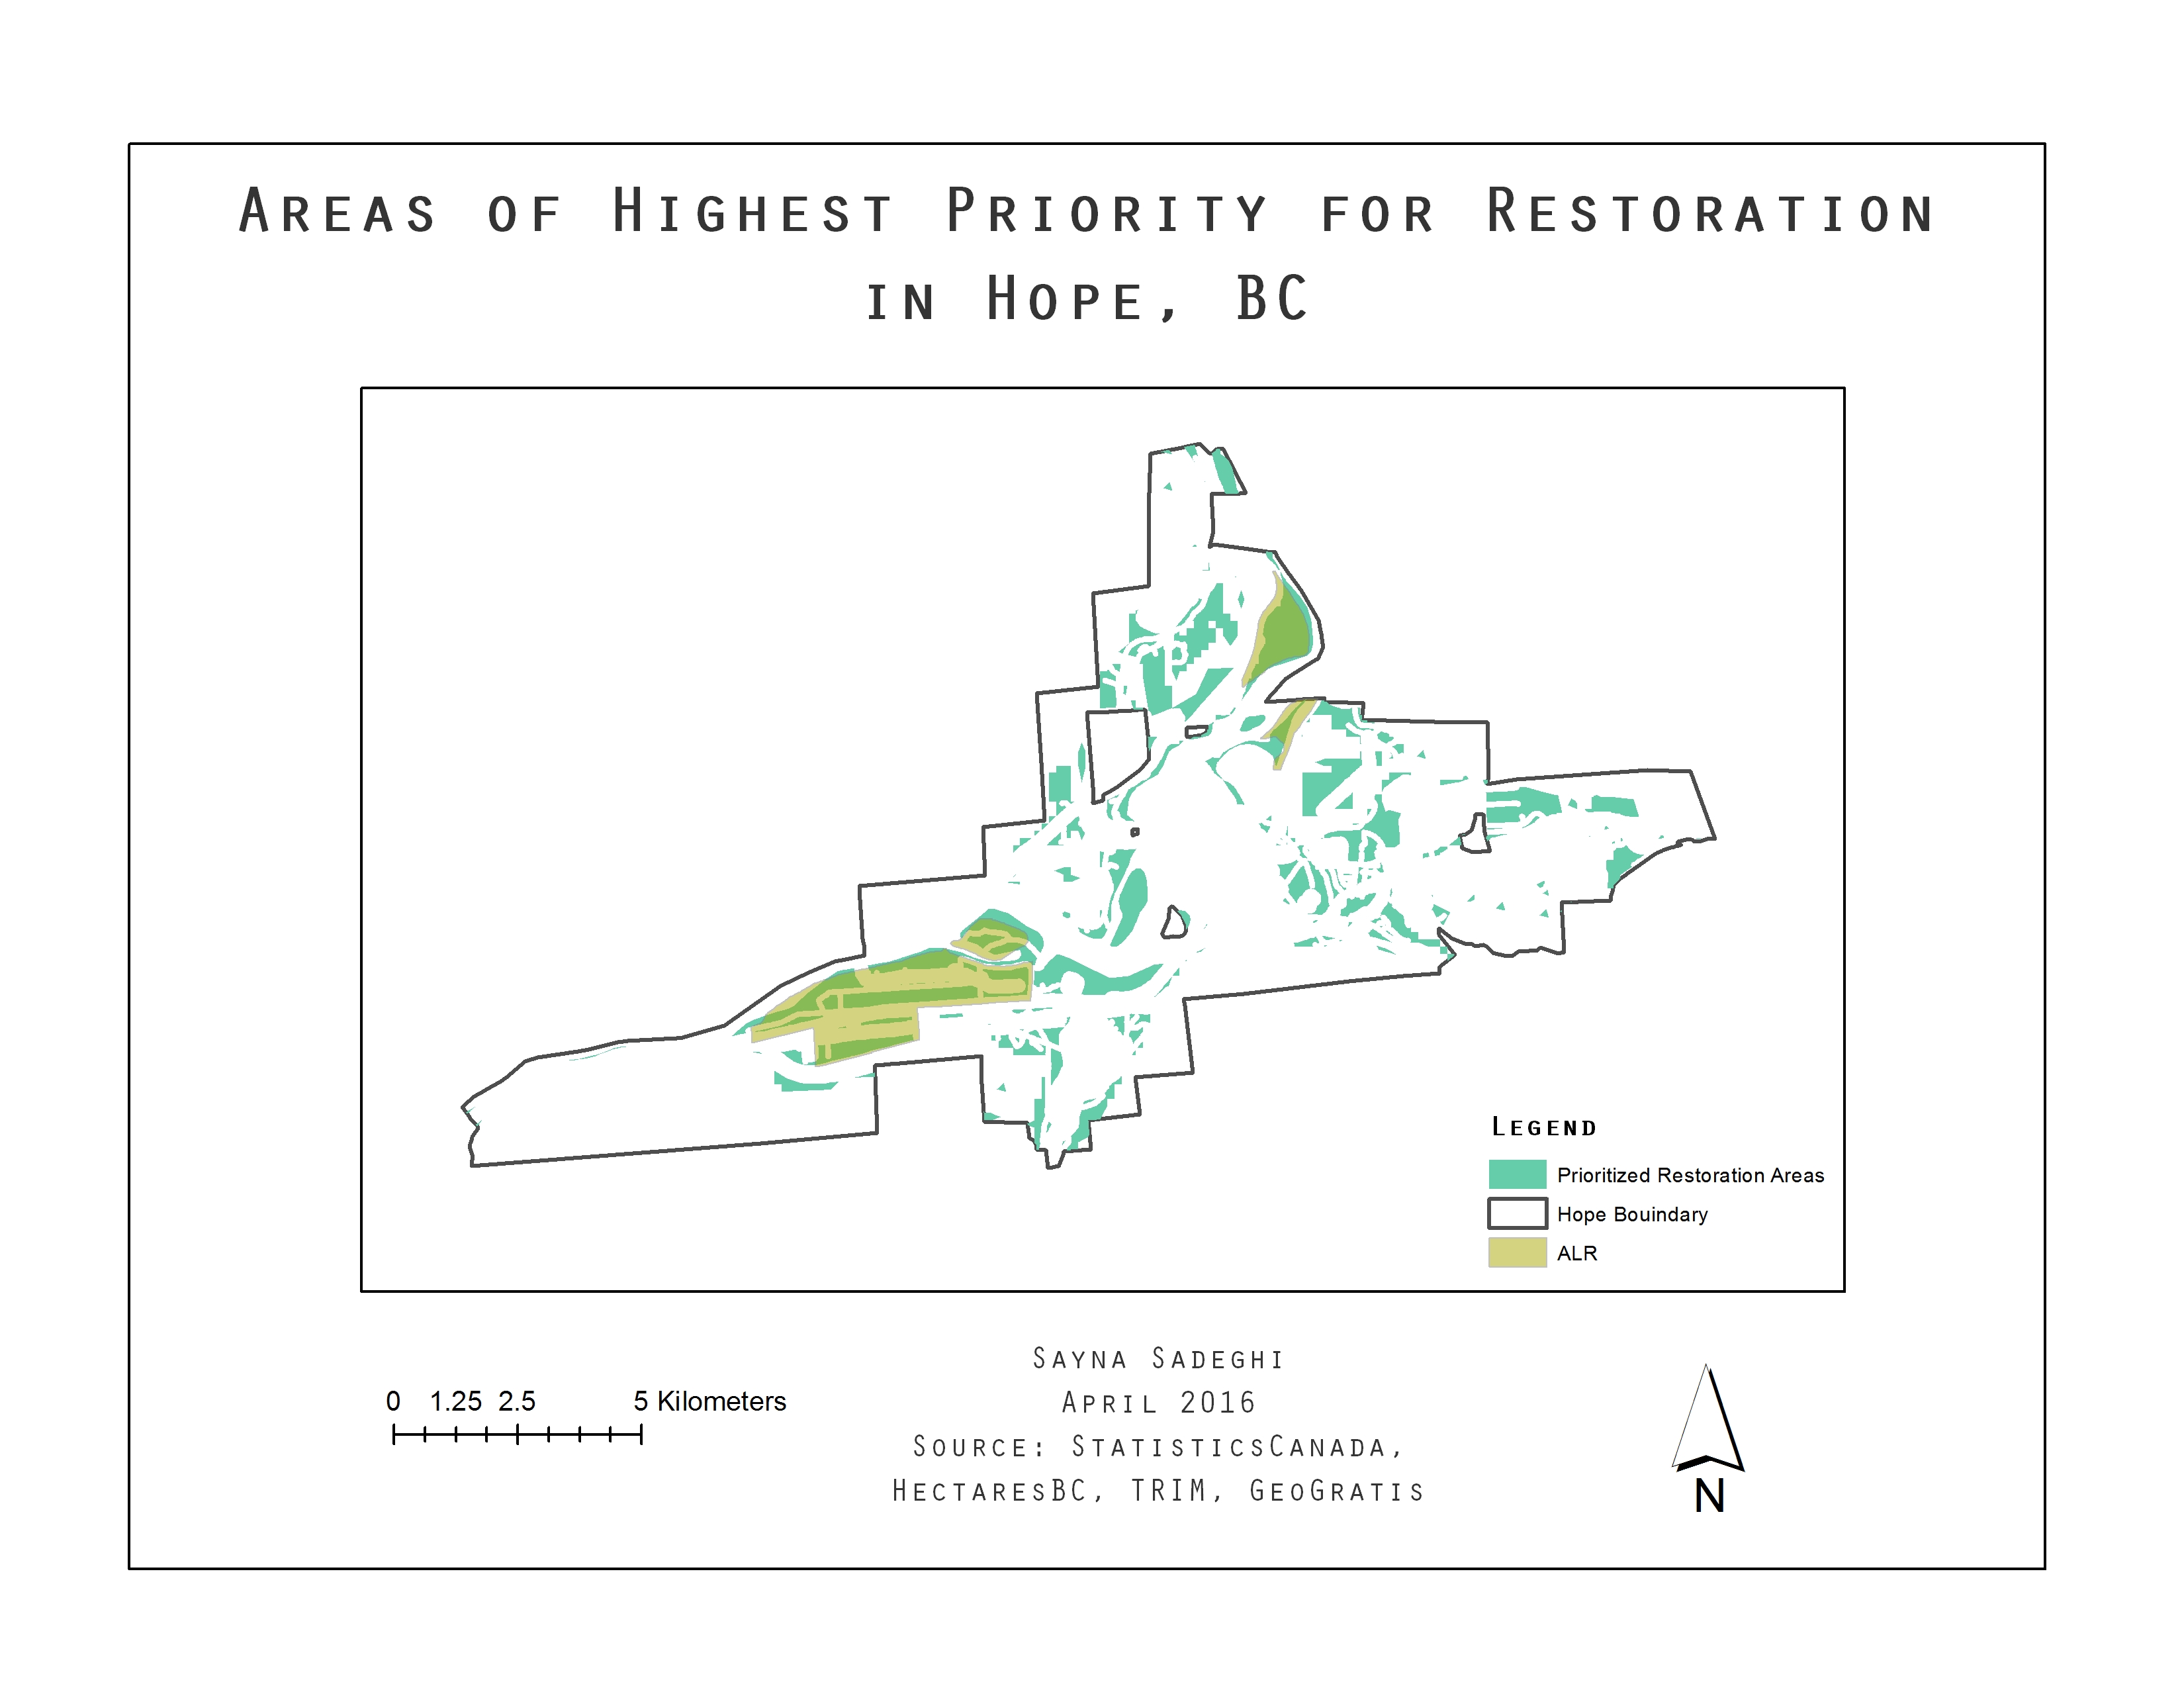
However, two significant parts of the prioritized restorable areas fall over Agricultural Land Reserves (Map 8).
The meaning and implications of these results are discussed in the ‘Discussion’ section.
Implication of Results
The intersected map of criteria 1 and 2 indicates sites that are both likely to succeed and would be most efficient in a restoration project. Some of these polygons are in close proximity to waterbodies (Map 6) creating an opportunity for restoration of riparian corridors, which are important for preserving water quality, providing food and habitat to aquatic and terrestrial species, protecting stream banks from erosion, providing storage area for flood waters etc. (County of Santa Cruz, n.d.).
It is important to look at Aboriginal lands within project areas for implementing projects. As Emery (2000) suggests in his report for ‘best practice principles’ Aboriginal communities should be provided with the chance to give ‘free, prior and informed consent’ or FPIC for any kind of project. FPIC is defined as “the right or desire of Aboriginal people to offer or withhold consent to developments that may have an impact on their territories or resources” (Gibson et al., 2016, p.162). That said, as we see in Map 7, prioritized restorable polygons intersect with Aboriginal Lands only in a few occasions.
Additionally, it is important to look at polygons that fall under Agricultural Land Reserves (ALR). ALRs are administered by the Agriculture Land Commission (ALC) in British Columbia and agriculture is recognized as the priority in these areas (ALC, n.d.). Therefore, implementing restoration projects in ALRs may not be practicable. Looking at Map 8, a significant portion of the prioritized restorable polygons are in ALR lands and these areas should not be prioritized for restoration projects.
Further Studies
There are many ways that further research could be added to this research. Some of these include:
- Looking at private and public ownership within the prioritized restorable polygons. Private lands might not be as efficient to target for this project.
- Looking at native and invasive plant communities within prioritized restorable polygons as invasive plant communities may hinder plant growth. Additionally, buffering and enhancing native plant communities could help protect them.
- For implementation of an actual project, identify sites that have the potential to increase ecological value (Lane et al., 2008). For example using Island Biogeography Theory (IBT) to find polygons with largest areas and least edges for higher probability of success in projects.
Limitations / Challenges
Here are some limitations and challenges I faced while working on my project:
- Date of data: Sometimes data layers were too old making me question their truthfulness. Additionally, in more than one occasion the dates of different layers did not match and had large gaps between them.
- Cell size: For a relatively small area like Hope it was difficult to find a DEM with high resolution (small cell sizes). I had to create DEM from contours I found in GeoGratis. Even then, resolution was still not ideal.
- Chosen criteria: It was difficult to connect literature review criteria to metadata available. Nonetheless, I went through every type of each class in all shapefiles to make sure they all make sense for this project and omitted the ones that didn’t.