
Our methods can be divided into three parts. Our main goal is to create a new MPA, which was created by overlapping different layers, including marine vegetation distribution, marine mammals distribution and distribution of biologically significant areas, and compare it to suitable locations determined by the sea surface temperature (SST) and bathymetry using Multiple Criteria Evaluation (MCE). Therefore, our first step was to establish the new MPA and the suitable locations determined by the two abiotic factors. Our final step would be to overlap both maps and to see if there is any overlap.
Our data is mainly spatial data, including locations or distribution of our variables and their associated attributes data. Our spatial analysis processes are based on the ArcGIS environment, in which we mainly used ArcGIS Pro. The projected coordinate system of our marine protected area would be NAD 1983 BC, Environment Albers. Our data also adopted the same system.
2.1 | Creating the MPA
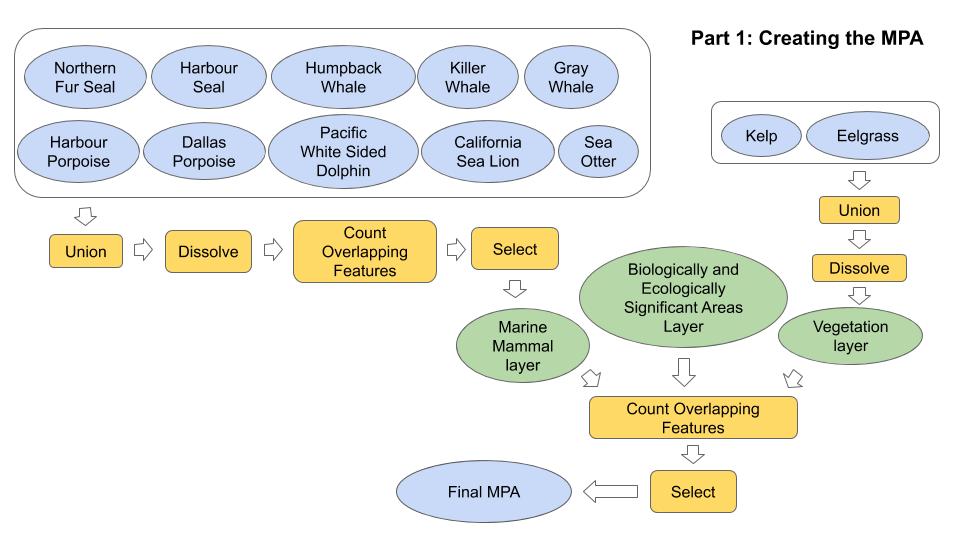
Diagram I. Flowchart for creating MPA
[Click here or the image to enlarge]
In the first step, we created an MPA which will be an area that will protect marine vegetation, marine mammals and biologically significant areas to the largest extent, following procedures of merging, dissolving and spatial join. We decided to use marine vegetation distribution, marine mammals distribution and distribution of biologically significant areas to create our MPA. Regarding our data sources, we downloaded our data (mainly shapefiles) from the BC Open Data Catalogue as well as the British Columbia Marine Conservation Analysis sites (refer to Appendix 1 for their sources). For the vegetation and mammal distribution data, we selected two (2) marine vegetation and ten (10) marine mammal species (see Data Table section for the full list of the species we selected).
After we collected our data, we first used the UNION tool and then the DISSOLVE tool to merge and dissolve the layers of species of vegetation into one layer, which combine the distributions of both vegetation species we selected. For the distributions of different marine mammal species, we used a COUNT OVERLAPPING FEATURES tool to calculate the number of overlapping distribution areas (i.e. the number of overlapping layers) of each location. Then, we used the SELECT tool to only select areas where five or more species were dwelling (i.e. five or more layers overlapping) (See Figure 1).
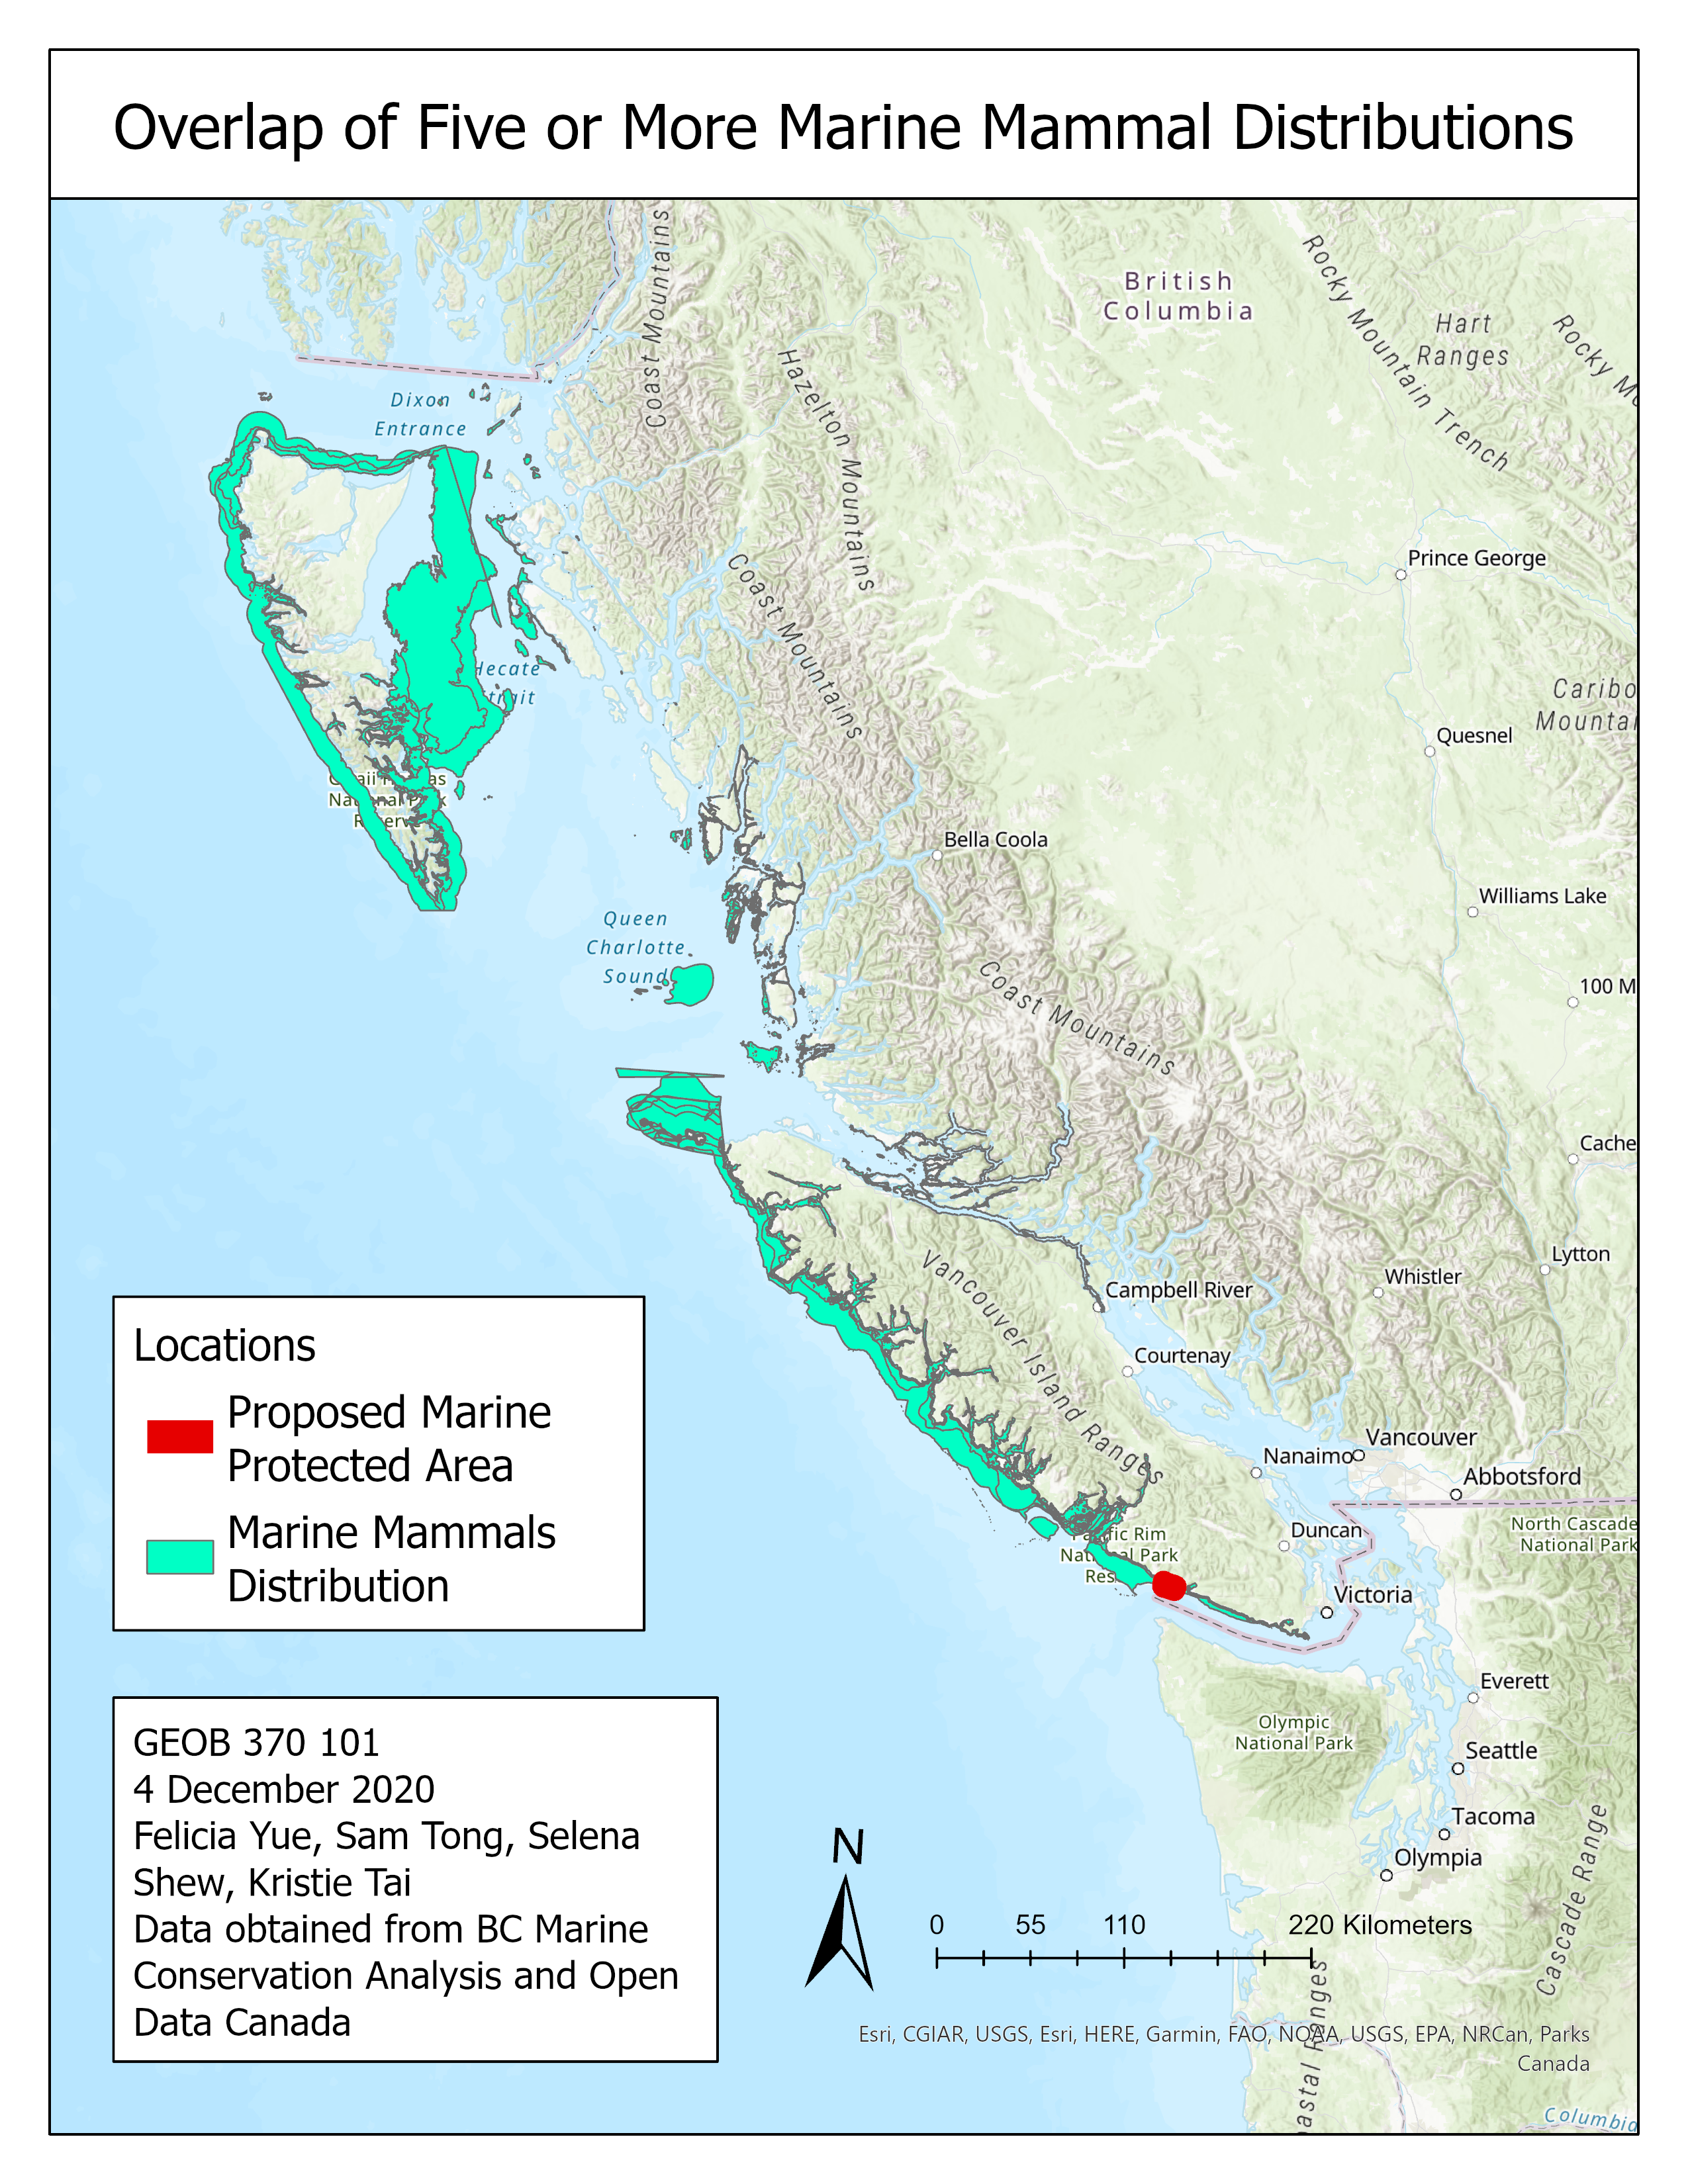
Figure 1. A map that shows the area with distributions of five or more marine species overlapping
[Click here or the image to enlarge]
With the two separate layers and the biologically significant area, we then used the COUNT OVERLAPPING FEATURES tool to create a layer that recorded the number of layers each polygon overlapped. Since we want to locate which area is biologically significant and contains the habitats of all the species, we only selected areas that have all three layers overlapping. In the end, we would look at the eligible area and then select an area that is significantly large in size.
We also compared the resulting MPA with the distribution of areas where commercial fishery is active. If the MPA overlapped with commercial fishery areas, it would also help prevent massive fishing activities from further disturbing the ecosystem in the MPA. We have also selected species of fishes that were targeted by commercial fisheries (see the Data Table section for the full list of 12 fish species we included).
2.2 | Locating Regions With Best Abiotic Conditions
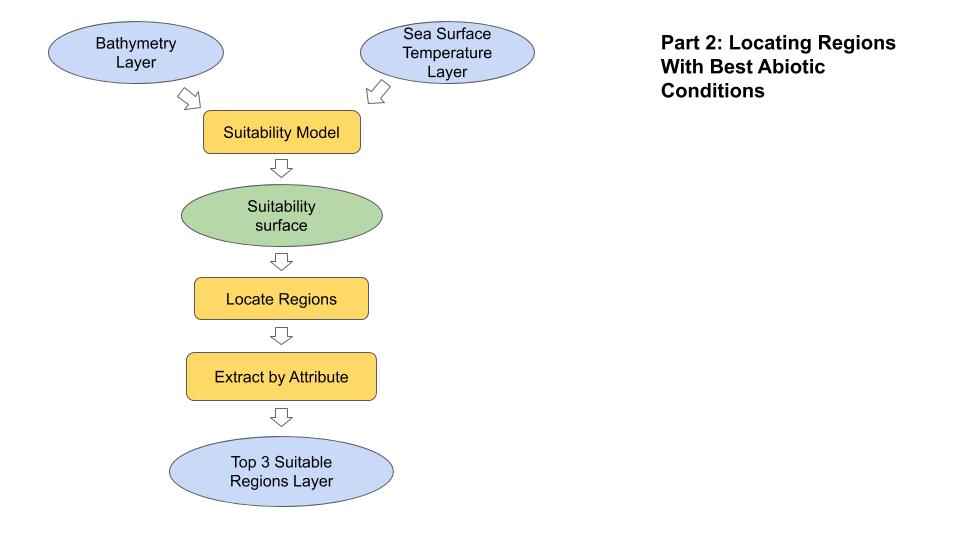
Diagram II. Flowchart for locating regions with the best abiotic conditions
[Click here or the image to enlarge]
In this second part, we will be conducting an MCE on SST (sea surface temperature) and bathymetry, using the suitability model. We selected these two criteria for our MCE because these two abiotic factors have the strongest influence on marine species richness (McHenry et al., 2019; Gagné et al., 2020). The weighting of bathymetry is higher than SST. See Table III for a summary of our criteria.
Regarding the data sources, the distribution of SST was provided by Giovanni, a website created by NASA that records different kinds of Earth data, while the bathymetry was provided by the BC Marine Conservation Foundation (BCMCA). See Data Table for reference.
Table III. Criteria for determining abiotic MPA and corresponding weights.
| Criteria | Weightings |
| Bathymetry | 63 |
| SST | 37 |
With the criteria and weightings, we then used these settings to perform our MCE using the suitability model on ArcGIS Pro. In our suitability model, the 2 files that represent the bathymetry and SST respectively were inputted, and the model would generate a suitability surface that shows how suitable a location is.
After the surface was established, we used a LOCATE REGION tool on ArcGIS Pro to identify the best location for establishing an MPA that has great habitability. For the configuration of the LOCATE REGION tool, we set the number of the best regions to be produced as 10, the tradeoff between maintaining the shapes of the resulting regions and how “useful” the sustainability scores of the regions are as 10 %, and the minimum regions’ sizes as 50 km2. We also accepted the default shape of regions as circular. The output of this locating best regions analysis was then further filtered, by selecting the top 3 most suitable regions among these 10 best regions using an EXTRACT BY ATTRIBUTE tool. These final three regions, ranked from the least to most suitable relatively, would be the potential sites where the SST and bathymetry were the most suitable for marine species. See Figure 2 for their locations.
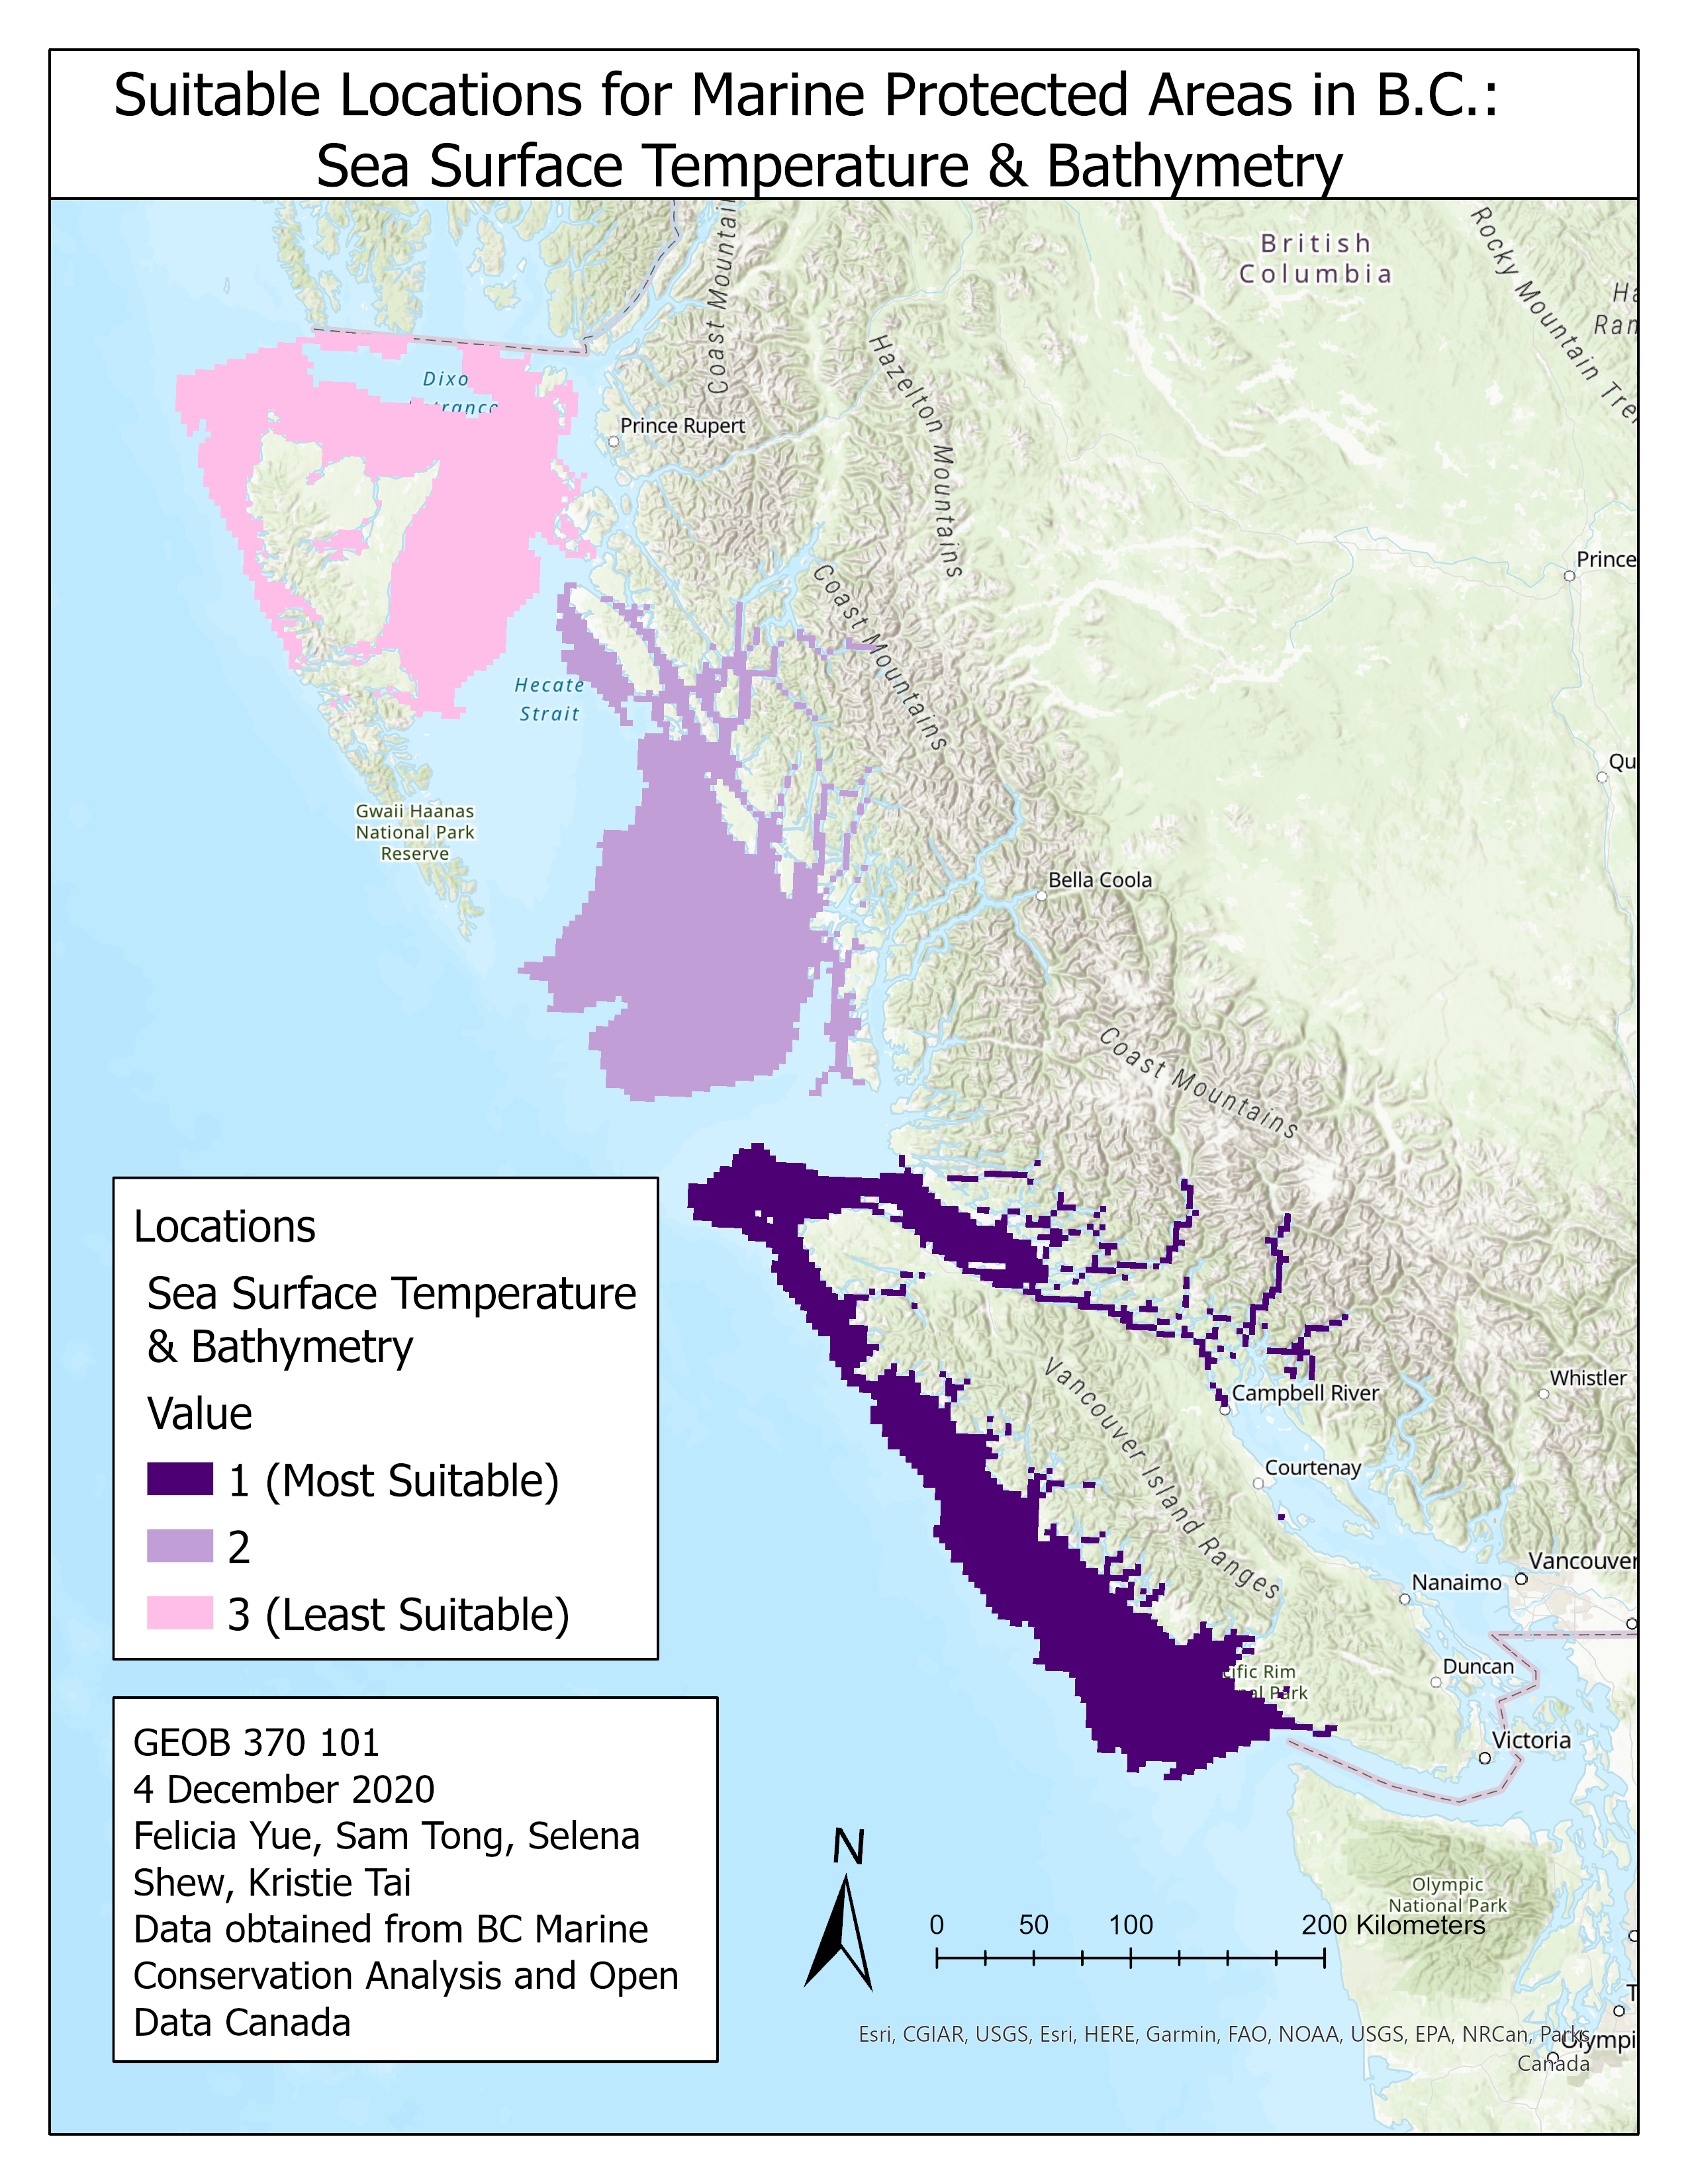
Figure 2. The map of the top three regions with the most suitable SST and bathymetry, ranked relatively
[Click here or the image to enlarge]
2.3 | Comparing the MPA with Physically Suitable Regions
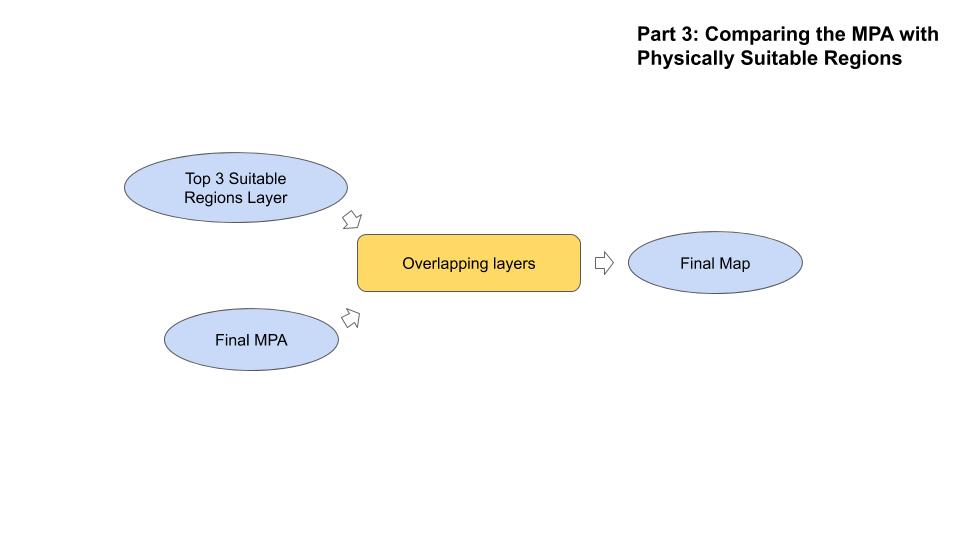
Diagram III. Comparing the MPA with physically suitable regions
[Click here or the image to enlarge]
Our last step was to compare the MPA that was based on three “simple” factors —— distributions of marine vegetation, marine mammals, and biologically significant areas —— with the three best regions that have the most suitable SST and bathymetry, the two “complicated” factors. For the comparison, we overlay the MPA with the three regions. If there was any overlap, it would indicate that the MPA would also be physically habitable by most marine flora and fauna.
Continue to our results.