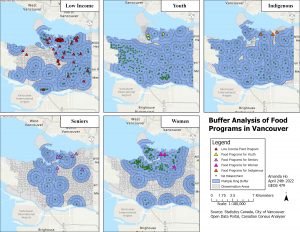
Figure 2. Multiple Ring Buffer for All Subpopulations
Women
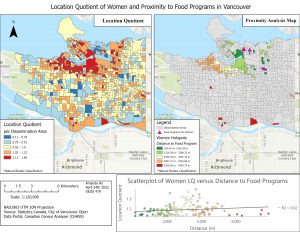
Figure 3. Location Quotient Map, Proximity Analysis and Scatterplot for Women and Food Assistance Programs
The LQ map in figure 3 indicates the distribution of women in Vancouver is concentrated slightly outside of the Downtown region, around Granville Island and Kitsilano. These hotspots have a population of women 1.1 to 1.4 times higher than the average of the city. Looking at the proximity analysis map, most DA hotspots are within 5000m of a food assistance program and this is supported by the scatterplot. The highest LQ of women are located 2000 to 4000m away from the nearest program. The shortest distance is 155m away from a food program and is located in East Vancouver. There are no programs in West or South Vancouver and these populations are impacted as they are 5000m to 7000m away. There is spatial disparity and unequal access to food assistance programs for the population of women in Vancouver. There are 28 DAs located within 1500 meters of the multiple ring buffer in figure 2. Out of the 129 DA hotspots for women, 21.7% are within close walking proximity to a food assistance program.
Indigenous
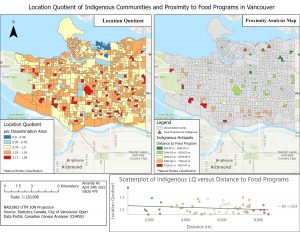
Figure 4. Location Quotient, Proximity Map and Scatterplot for Indigenous Communities and Food Assistance Programs
For the Indigenous LQ map, there are hotspots across Vancouver but they are fragmented. The locations of food programs are located in the Downtown Eastside yet the DAs with the highest LQ for Indigenous communities are located south of the programs. This indicates that the majority of Indigenous communities reside away from the urban core in residential areas. Figure 4 demonstrates that the population is residing far away from the programs, meaning that the location of the food programs are inefficient. The DA hotspots had an Indigenous population 1.2 to 1.4 times higher than the city’s average. The closest food program indicated in figure 4 is 824m away. While the closest food program is servicing the highest LQ, it is nearly 1km away. The distance map indicated that the majority of DAs with a high concentration of Indigenous communities are located over 2000m away from a food assistance program. We can see that the DAs are fragmented and isolated from each other. Particularly near UBC, those populations are travelling around 8000m to access affordable food, which may not be practical for all three meals. There is a lack of food program services in West, South and East Vancouver thus programs in these areas could alleviate food insecurity that Indigenous communities in these regions may be experiencing. There is only one DA out of 57 hotspots that is within 1500m, which means that only 1.75% of hotspots are near a food assistance program (Figure 2).
Seniors

Figure 5. Location Quotient, Proximity Analysis and Scatterplot for Seniors and Food Assistance Programs
A significant proportion of Vancouver appears to have a low proportion of seniors in figure 5. Many DAs report a lower than average population of seniors but there is one DA with an extremely high LQ score. In that sole DA, the population of seniors is 6.03 times higher than the rest of the city. The hotspots used in the proximity analysis had a significant senior population, with an LQ score between 2.76 and 6.03. The highest LQ DA is located just over 1000m away from the closest food assistance program. The location of the senior food programs are around the Downtown Eastside, where they are coldspots for the subpopulation. The closest facility to a senior DA is only 350 meters however, much of the senior population would need to travel around 2000m to access food assistance. Seniors living in Central Vancouver and South Vancouver are not well-serviced and would need to travel between 4000 and 6000m. There are 4 out of 12 senior DA hotspots that are within 1500m of a food assistance program (Figure 2). Senior food assistance programs are in close proximity to only 33% of DA hotspots.
Youth

Figure 6. Location Quotient, Proximity Analysis and Scatterplot for Youth and Food Assistance Programs
There is significant clustering of youth on the West side of Vancouver as seen in figure 6. Here the LQ for youth is at its highest, between 1.32 and 2.92 in those DAs. Again, the food programs are located in Downtown and the Downtown Eastside, which is not reflected in where the majority of youth populations reside. Similar to what the other distance map and LQ showed, hotspots that are further away are less serviced. There is unequal access to food programs as certain DAs are 300m away while the furthest DAs are over 9000m away. While the hotspots have a similar population concentration, the disparity in access is vast. Most DAs are located over 2000m away from the nearest program, as seen in the scatterplot of figure 6. There is a difference in the spatial clustering of youth between West and East Vancouver, but they are both under-serviced areas for food assistance programs. In figure 2, it was shown that only 4 out of 153 DA hotspots are within 1500m of a food program. Food assistance programs for youth are only in close proximity to 2.61% of the highest population areas.
Low Income
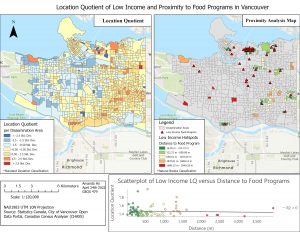
Figure 7. Location Quotient, Proximity Analysis and Scatterplot of Low Income and Food Assistance Programs
Low Income is the subpopulation with the highest number of food programs servicing them, as seen in figure 7. The distance map shows that low-income programs are more accessible and available throughout the city. The majority of the food programs for low income are located in Downtown with scattering in East Vancouver. The food programs coincide with where there are populations of low-income DA better than the other subpopulations. There are only three programs catering to the West side of Vancouver. The shortest distance is only 17m while the furthest DA is less than 4000m away. Outside of the Downtown Eastside, there are several DAs which are near food programs, which is unlike the other subpopulations. Many of the DAs are located less than 1500m from a food assistance program which indicates that this subpopulation is well-serviced. There are enough programs in proximity to where the subpopulation is residing but there are a few DAs that are 2000 to 4000 meters away which still need to be addressed. Low income has the highest percentage from the buffer analysis. Food assistance programs for low income are near 77 out of 82 DA hotspots, which is 93.9%.