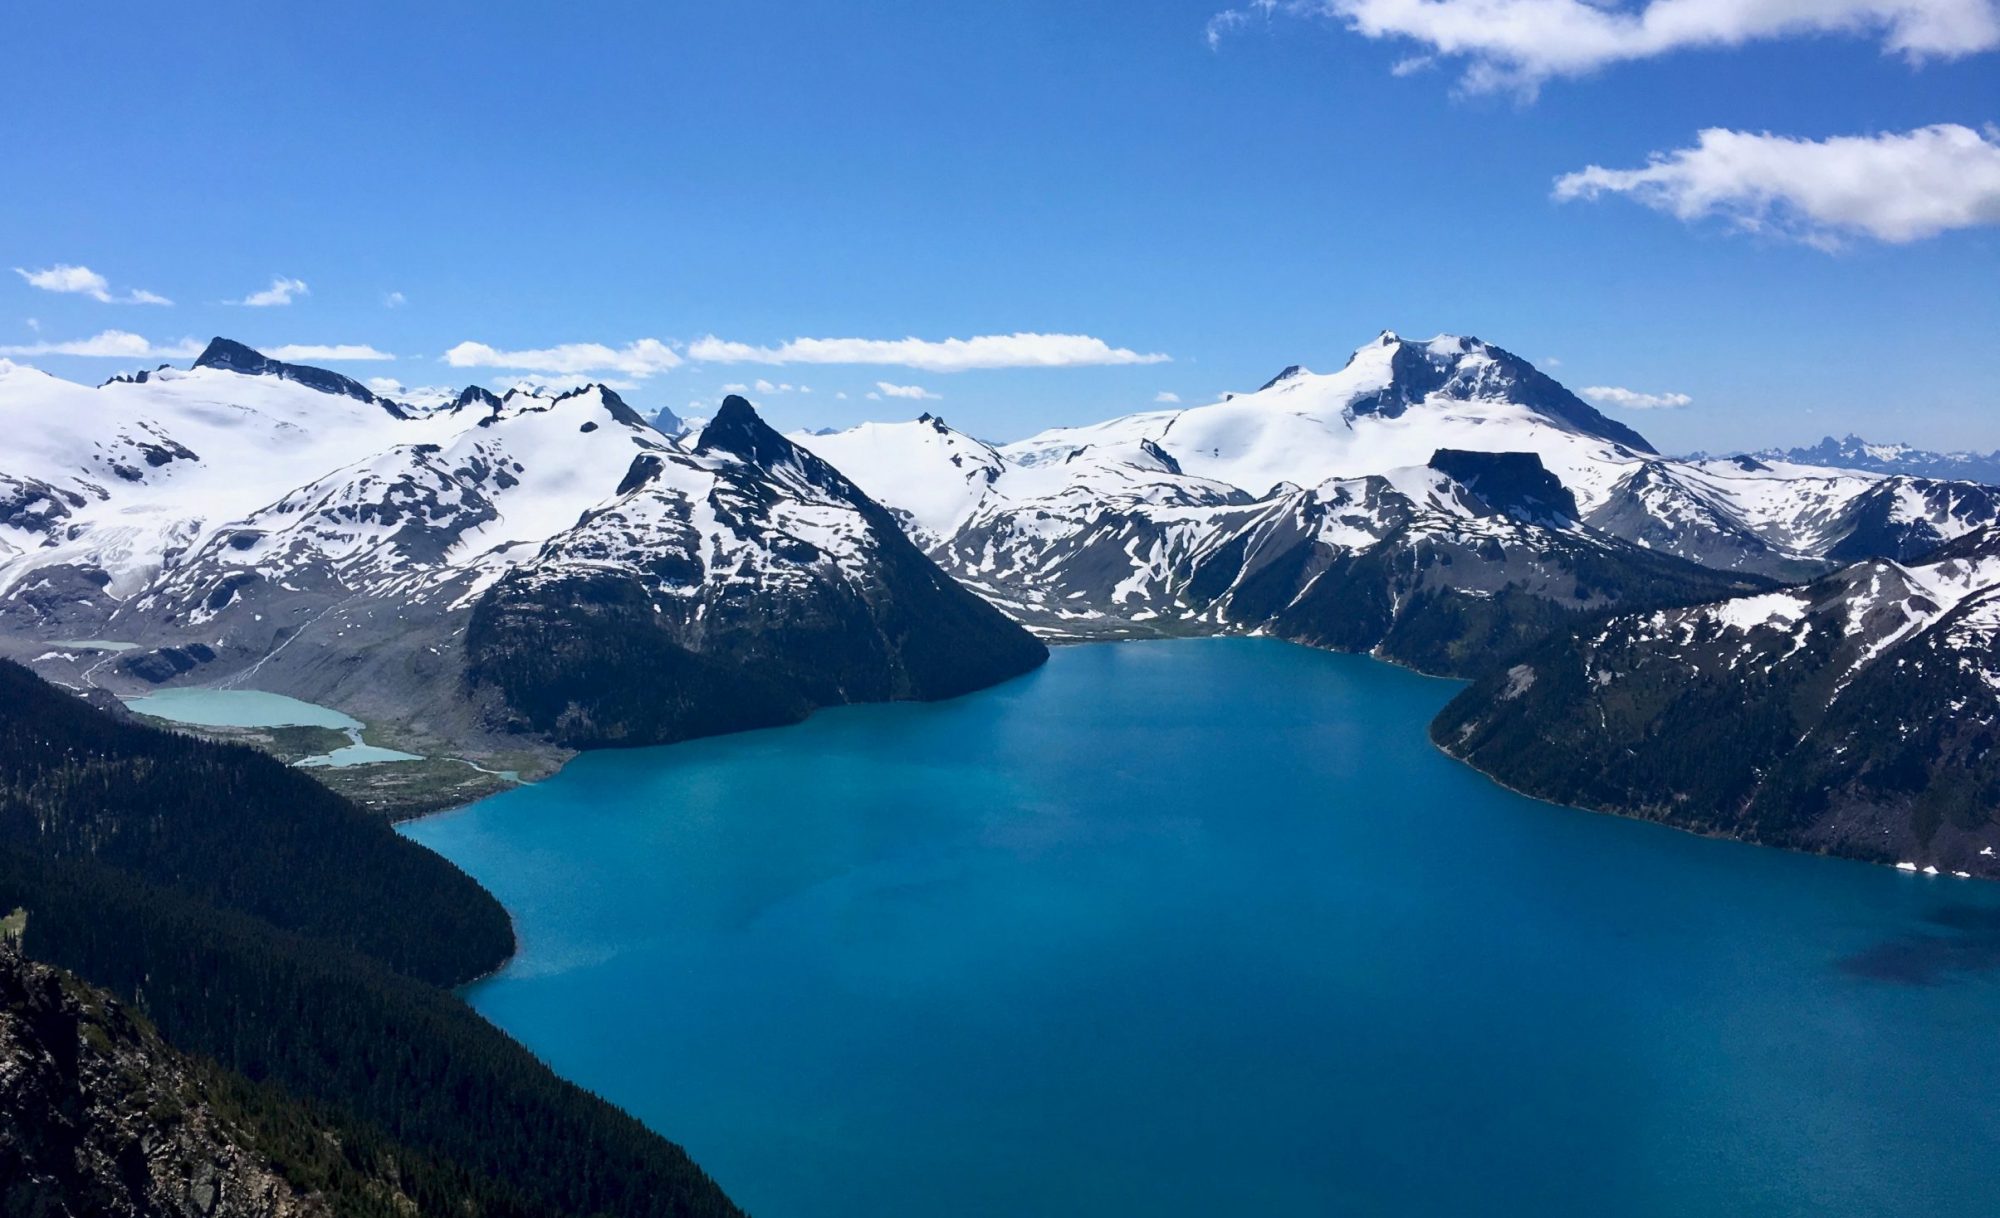
This GIS project can be divided into two parts: (I) Hazard Assessment and (II) Evacuation Plan; the former depicts the geospatial volcanic hazards associated with the Garibaldi volcano. Results from the first part of the project are used in the second part for planning emergency evacuation routes for the Squamish and Whistler population in the event of a Garibaldi volcanic eruption.
The following flowchart summarises the analytical steps used in this project:
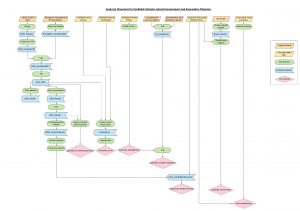
This flowchart can be accessed and viewed in high resolution at this link.
To set up the project, the DEM CDED files were merged together by using Mosaic to New Raster tool. The coordinate system of the resulting merged DEM was then transformed into UTM Zone 10N to ensure compatibility with Laharz assessment tool (discussed in Hazard Assessment section). From this point on, all data is consistently projected in the same coordinate system. Finally, the merged DEM is clipped to Project Boundary to restrict GIS analysis in southwestern BC area.
1. Hazard Assessment
There are many hazards associated with volcanoes, some of the major ones include:
(I) Pyroclastic flows: fast-moving fluidized masses of lava material, volcanic ash, and hot gasses;
(II) Lahar: volcanic mudflows that are composed of pyroclastic material, rocky debris and water, flowing rapidly downhill on the slopes of the volcano and typically along a river valley. Lahars travel in high velocity and bring devastating damage to forests and artificial structures, including bridges, roads, pipelines, and buildings (U.S. Geological Survey, 2015).
(III) Tephra: fragmental material of rocks, namely ash (< 2 mm in diameter), lapilli (2 to 64 mm in diameter), and bombs (> 64 mm in diameter), which are produced by a volcanic eruption when magma or rock is explosively ejected; and
(IV) Lava flows: streams of molten rock that spout from the volcanic vent.
In this volcanic hazard assessment, a hydrology analysis (sub-section 1.1) is firstly carried out to generate hydrology raster datasets that supplement Laharz software (sub-section 1.2) used for identifying volcanic hazard zones.
1.1 Hydrology Analysis
A hydrology analysis was carried out to generate three raster layers that were used later for delineating volcanic hazard zones (see sub-section 1.2). Firstly, a depressionless DEM was created by using the Fill tool to fill depressions in the DEM raster, ensuring proper drainage patterns. Then, Flow Direction and Flow Accumulation for each raster cell in the depressionless DEM were calculated and used as inputs in the Con tool to delineate stream networks of the area.
1.2 Laharz_py
Laharz_py was primarily used to identify Garibaldi volcanic hazards. Laharz_py is a software designed by USGS to automate the mapping of Proximal Hazard Zone and Lahar Distal Zone based on topography and statistically-derived equations (Schilling, 2014).
- Proximal hazard zone
Proximal hazard zone can be defined as near-volcano high-risk areas, susceptible to pyroclastic flows, lava flows, ballistic tephra (ash, lapilli, and bombs), debris avalanches.
Using the Hazard Zone Proximal tool from laharz_py, the proximal hazard zone of Garibaldi Volcano is delineated from points of intersection between topography and the height/length (H/L) runout cone of the volcano. While there is a range of slopes of the Garibaldi volcano, the average value of 0.3 is used as the slope value of the cone. The depressionless DEM and stream network raster layers generated from the hydrology analysis, along with the slope value and user-specified coordinates of the Garibaldi volcano peaks were entered into the tool. The tool then generated an automated mapping of the proximal hazard zone by calculating the elevations of each cell in the cone raster using the equation:
H(apex) – H(cell) / L(apex) – L (cell) = S
where;
H(apex) is the height of user-identified cone apex;
H(cell) is the height of the raster cell;
L(apex) is the location of user-identified cone apex;
L(cell) is the location of the raster cell; and
S is the user-specified slope value.
The tool utilizes a Euclidean distance algorithm to calculate [L(apex) – L(cell)] of the equation, which then solves for H(cell).
- Lahar distal zone
Lahar distal zone refers to an area of potential lahar inundation areas based on user-specified volumes and starting locations. The Lahar Distal Zone tool in laharz_py delineates the lahar distal zone of Garibaldi volcano based on two equations relating lahar volume to the cross-sectional area of inundation and planimetric inundation area:
A = 0.05 V^(2/3)
B = 2000 V^(2/3)
where;
A is the cross-sectional area of inundation;
B is the planimetric inundation area; and
V is the volume of lahar.
With this tool, the depressionless DEM is used along with user-generated textfiles for the starting point coordinates and lahar volumes. Headwaters on the Garibaldi volcanic cone were selected as starting point coordinates of lahars, whereas hypothetically lahar volume used was 100,000 m³. A recent eruption in the Ring Creek lava flow from Opal Cone, another nearby peak by the Garibaldi volcano occurred 10,000 years ago. Based on documentation of the recent eruption and geomorphological inspection of the area, the volume of the Ring Creek lava flow was found to be approximately 10,000 m³. In our project, we assigned an order of magnitude larger for the lahar volume as a hypothesis to test the maximum amount of lahar volume erupted from the Garibaldi volcano.
Generalization was done afterward for smoothing the raster layer of lahar zones to eliminate zone boundary outliers. Nibble tool was used to edit areas of raster data that is inaccurate by masking it to the assigned values of the nearest neighbor values. As a result, erroneous areas in the lahar distal flow data can be eliminated.
1.3 Buffer Analysis
Ashfall is estimated to extend a maximum of 50 km from the volcanic vents as suggested by USGS in the 1998 volcano hazard assessment of Mt Rainier. Mt Rainier is the nearest stratovolcano that can be compared similarly to the Garibaldi volcano. Mapping of ashfall extent is done by applying a 50 km buffer from the three peaks.
2. Evacuation Plan
2.1 Impacted Population within Hazard Zone
The 50 km buffer from the Garibaldi volcano was used as a proxy to analyze the impacts on the nearby population centers. Dissemination area (DA) boundaries from Statistics Canada were used as they provide the finest geography unit that covers the whole of Canada (Statistics Canada, 2018). Data for population density per square kilometer were retrieved from the 2016 Census and joined to the DA boundaries that are clipped to the 50 km buffer.
2.2 Service Area Analysis
A service area analysis was carried out in the susceptible lahar inundation region and to study evacuation efficiency according to the estimated response time.
To estimate response time for evacuation, the flow length of the lahar paths from the volcano to the impacted area was calculated. All the lahar flow distances are around 20 km. Using an estimated lahar flow speed of 80 km/h (Gates & Ritchie, 2007), an estimated response time range of 15 to 20 minutes was generated from a simple calculation:
Response time (min) = Lahar flow distance (km) / 80 (km/h) x 60 (min/h)
The service area analysis was performed based on the 15 min and 20 min response time from the selected locations within the susceptible lahar inundation region. The selected locations are prioritized to population centers, or places required more evacuation time.
2.3 Evacuation Route Analysis
A route analysis was carried out to identify the fastest evacuation paths for impacted population centers. First and foremost, the BC roads dataset was altered such that an attribute table field was added for speed limits which were assigned to each road type based on BC speed limit laws as follows:
Built-up areas: 50 km/h (30 mph);
Rural roads: 80 km/hr (50 mph);
Major highways & expressways: 110-120 km/hr (70-75 mph).
Then, another additional “Minutes” field was added to the attribute table of roads dataset, wherein the travel time was calculated with Field Calculator by using the following formula:
Travel time (min) = Road length (km) / Speed limits (km/h) x 60 (min/h)
The road polyline layer was then transformed into a network dataset and its unit of attributes was set to minutes. From there, two locations at northern and central Squamish with the longest evacuation time were selected. Routes from the selected locations within Squamish and Whistler to nearest safe evacuation centers (Vancouver and Lillooet) outside of the hazard zones were solved by using the ArcGIS Utility Network Analyst tool.