Learning objectives
This post is about topics explored in the third GIS laboratory session, which had the following learning objectives:
1. Perform basic geographic analysis to determine areas for possible tsunami:
- Perform buffer proximity analysis;
- Reclassify raster layers;
- Convert raster to vector data files;
- Combine vector data layers with polygon overlay tool intersect.
2. Performing geographic analysis to extract Vancouver data affected by possible tsunami:
- Combine vector data layers with the polygon overlay tool intersect;
- Perform a proximity analysis using select by location;
- Extract datasets with the polygon overly tool clip.
3. Calculate statistics (areas, length) of Vancouver land use and roads affected by a potential tsunami:
- Create summary tables by area of land use;
- Create lists of facilities affected;
- Create summary tables of road infrastructure affected.
4. Add layer of potential signage points:
- Learn how to create a new feature class, explaining the different types (point, multipoint, etc…);
- Introduce basic editing of features and tables (change values on individual table cells, modification/creation/deletion of features);
- Introduce the concept of snapping parameters for more accurate positioning of new feature.
Why a study of tsunami risk for Vancouver?
During the Lab 3 session for GEOB 270, I was tasked to conduct a GIS analysis on areas of the City of Vancouver at risk of a tsunami, and prepare a map highlighting these areas. Why conduct a study on Vancouver’s coastal areas at risk of a tsunami when the risk is so small due to the presence of Vancouver Island? The answer is that we always need to anticipate the worst possible outcome and take precautions to ensure that we are not caught offguard even if the odds are against our favour; the idea of “Precautionary Principle”. After all, we know how strong the forces of Nature are and a tsunami that can breach Vancouver Island is not impossible.
In summary, I had to analyze:
- The percentage of the City of Vancouver’s total area at risk of being hit by a tsunami (“danger zone”); and
- The healthcare and educational facilities within the danger zone.
Percentage of City of Vancouver’s total area at risk of being hit by a tsunami
To calculate this percentage, we essentially need only two values: (1) the area of the City of Vancouver at risk of being hit by a tsunami (or “area of danger zone”); and (2) the total area of the City of Vancouver. We then use the following formula to calculate the required percentage: (Area of danger zone) / (Total area of the City of Vancouver) x 100%
Before we can calculate this percentage though, we need to obtain the two values first through GIS analysis of the datasets provided. The way I did it through ArcMap, is as follows:
1. First, I found the intersected the “Vancouver_landuse” and “Vancouver_Danger” datasets and exported it as a new layer “Vancouver_landuseDanger“. What this does is that it selects the parts of Vancouver where it is 1 meter above sea level and below, which are usually along the coast lines.
2. Then, I opened the attribute table of “Vancouver_landuseDanger” and used a function called “Summarize” on the categories of landuse. This creates an output summary table that shows you the total area for each landuse zones that are at risk of being hit by the tsunami (this is the first value required in the formula).
Here is the output summary table generated:
| Category | Sum of area (m2) |
| Commercial | 180116.661665 |
| Government and Institutional | 188548.87032 |
| Open Area | 1090308.182289 |
| Parks and Recreational | 4627741.339941 |
| Residential | 3639795.736536 |
| Resource and Industrial | 5851705.112399 |
| Waterbody | 298316.863803 |
| Total | 15876532.766953 |
3. For the other value required in the formula, I simply opened the attribute table of the “Vancouver_landuse” layer and applied a function called “Statistics” on the area of each landuse zone. The output contains a sum of the areas of all landuse zones in the City of Vancouver, which is equal to 131020600.022758 m2
4. I then apply the formula to obtain the area of danger zone:
Percentage of Vancouver’s tsunami danger zone = 15876532.766953 / 131020600.022758 x 100% = 12.12%
Healthcare and educational facilities within the danger zone
To find out the healthcare and educational facilities within the danger zone, we use a process similar to how we find the Vancouver tsunami danger zone above. The method I used in ArcMap to do this is as follows:
1. I used the “Select By Location” function under the “Selection” tab in the top menu, and selected features under the “Vancouver_education” and “Vancouver_health” datasets that are within the “Vancouver_Danger” source layer. Recall that the “Vancouver_Danger” layer shows areas of Vancouver that are 1 metre above the sea level and below. This essentially works like the “Intersect” tool used above, where only the educational and healthcare facilities that can be found in the areas of Vancouver that are 1 metre above the sea level and below are selected.
2. Then, I exported the selected educational and health facilities within the danger zone as a new layer each. I used the “Merge” tool to come both layers, and opened the attribute table to extract the required information. Alternatively, you can open the attribute table and extract the required information from each exported layer without merging them.
Educational facilities in the danger zone:
- EMILY CARR INSTITUTE OF ART & DESIGN (ECIAD)
- HENRY HUDSON ELEMENTARY
- FALSE CREEK ELEMENTARY
- ST ANTHONY OF PADUA
- ECOLE ROSE DES VENTS
Healthcare facilities in the danger zone:
- FALSE CREEK RESIDENCE
- VILLA CATHAY CARE HOME
- BROADWAY PENTECOSTAL LODGE
- YALETOWN HOUSE SOCIETY
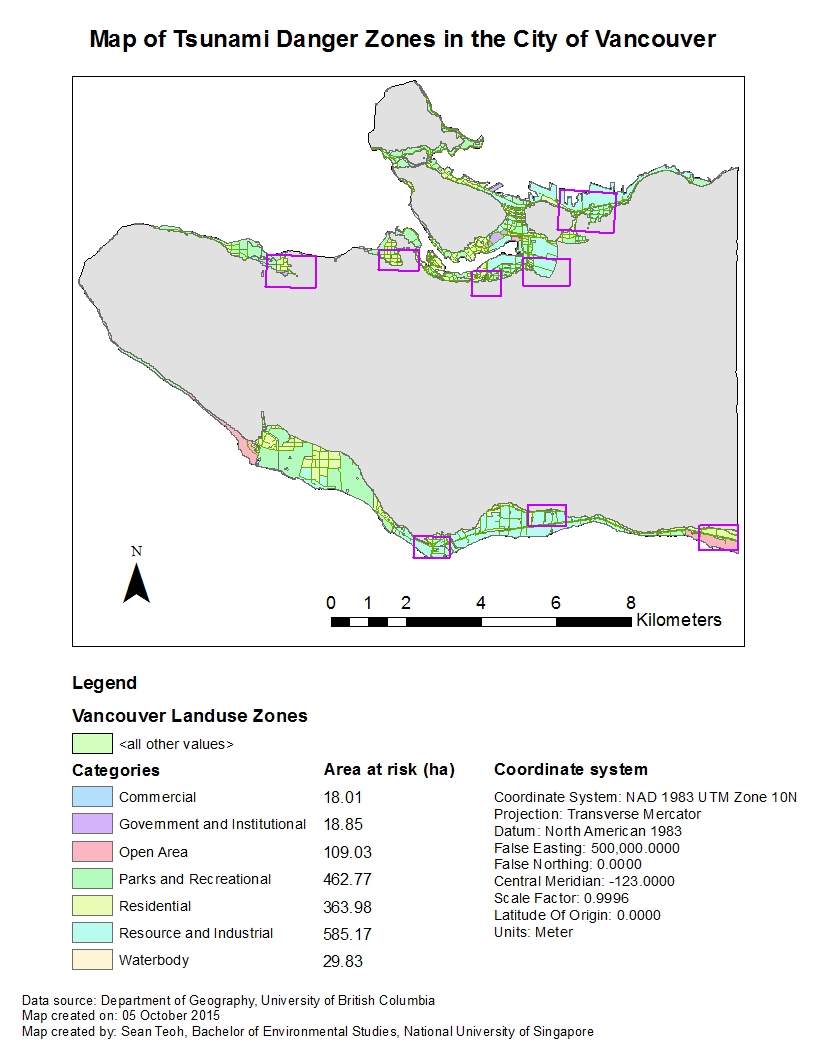
Finally
To end off, this is a map of the City of Vancouver, that I created, showing the areas at risk of being hit by a tsunami.