Learning objectives
This post is about topics explored in the fourth GIS laboratory session, which had the following learning objectives:
1. Developing a working knowledge of Canadian Census Data:
- Downloading Spatial and Tabular Census Data
- Join tabular data to spatial layers
- Visualizing housing data
- Terms of Canadian Census Data collection
2. Understanding quantitative data classification, and creating a map to illustrate the difference between four methods of classification:
- Natural breaks,
- Equal interval,
- Standard deviation; and
- Manual breaks
3. Working with ratios to compare datasets, and normalizing data to determine housing affordability.
4. Creating maps of GIS analyses results.
What is affordability?
Affordability is a measure of a person’s ability to buy a specific item relative to the person’s income. In the context of purchasing a house, housing cost alone is often not sufficient to accurately determine the affordability of a house. This is because of differences that exist between people’s income and the cost of a house. For example, a house may cost $300,000. To a person who earns $10,000 a month, it may seem that the house is very affordable. However, the same cannot be said for a person who earns only $2,000 a month, who may feel that the house is too pricey for the income s/he is earning. As such, affordability is a better indicator of housing affordability compared to housing cost alone.
Housing affordability rating categories
There are four housing affordability rating categories:
- Severely unaffordable
- Seriously unaffordable
- Moderately unaffordable
- Affordable
These categories were created the Annual Demographia International Housing Affordability Survey to assess the level of affordability of housing in countries that are part of the survey. They are based on the “Median Multiple” concept, defined as the “median house price divided by gross annual medium household income”, which is widely adopted and recommended by many international organizations such as the World Bank, United Nations, etc.
How do we interpret Median Multiple values? A Median Multiple value of 2.0 means that median house prices are 2 times median household incomes, indicating that if all income by the household is used to pay off the cost of a house, two year’s worth of salary would be needed to pay the full cost. Similarly, a Median Multiple value of 4.5 means that median house prices are 4.5 times median household incomes. This essentially means that the higher the Median Multiple value, the more unaffordable housing becomes.
Historically, the Median Multiple value has remained at 2.0 to 3.0 among six surveyed nations of the Annual Demographia International Housing Affordability Survey (i.e. Australia, Canada, Ireland, New Zealand, the United Kingdom, the United States). A Median Multiple standard of 3.0 was also cited in academic research by Arthus C. Grimes, who previously served as Chair of the Board of the Reserve Bank of New Zealand for 13 years. Hence, a Median Multiple value of 3.0 is considered to be the benchmark for determining affordable housing–any Median Multiple value greater than 3.0 would indicate that housing is unaffordable (albeit with varying degrees of unaffordability).
Adding in the range of Median Multiple values into the four housing affordability rating categories mentioned above, we can now quantify the affordability of housing in a region or country:
- Severely unaffordable (Median Multiple of 5.1 and over)
- Seriously unaffordable (Median Multiple of 4.1 to 5.0)
- Moderately unaffordable (Median Multiple of 3.1 to 4.0)
- Affordable (Median Multiple of 3.0 and under)
The following figure shows a map comparing housing affordability in Vancouver and Montreal I created for my fourth laboratory session in GEOB 270.
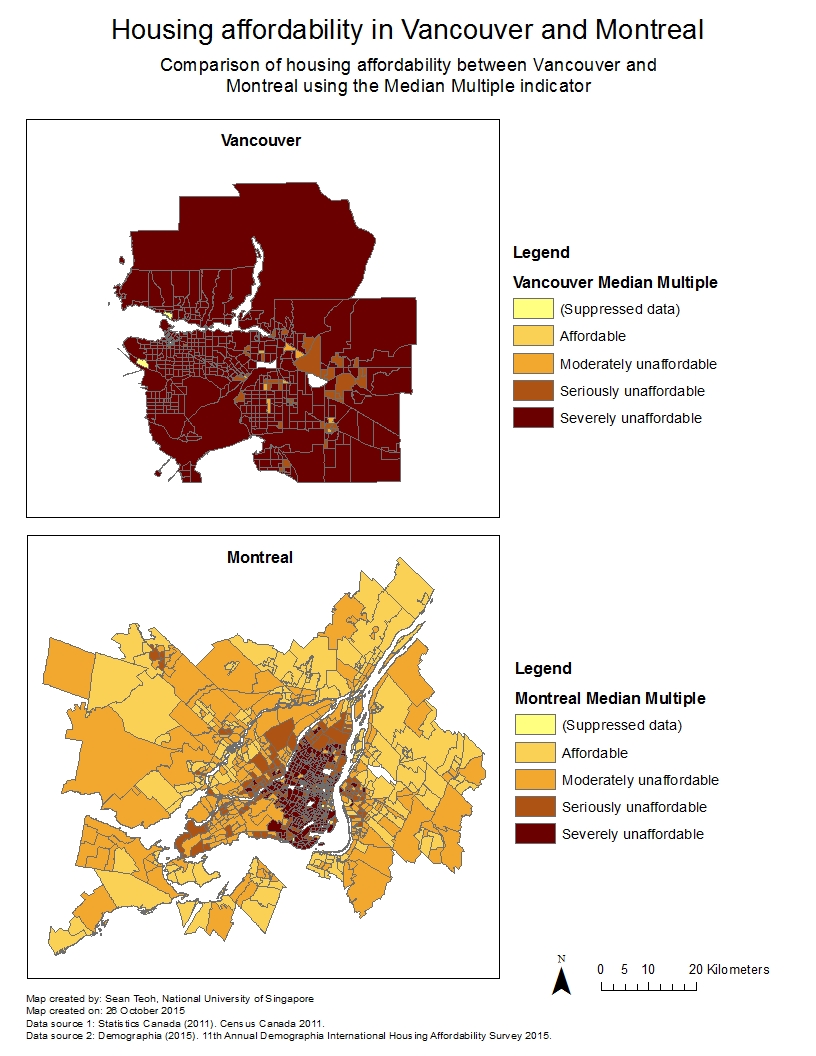
Figure 1 – Comparison of housing affordability between Vancouver and Montreal using the Median Multiple from Demographia, based on the “manual breaks” method of data classification.
Is there a relationship between housing affordability and a city’s ‘liveability’?
Housing affordability is not a good indicator of a city’s liveability, mainly because liveability defines the quality of life a resident can expect in a city which comprises so much more than purely economic or financial factors. Apart from economic or financial factors, liveability is also affected by social and environmental factors — How safe is the city? Are people generally polite and considerate? Are there many natural and urban amenities for recreation? Are healthcare facilities established and accessible?
Furthermore, housing affordability does not give any sense of the quality of housing! While a house can be very affordable, the house may not have been built or maintained properly due to cost-cutting measures adopted. Any defects or repairs required will incur not only additional costs but also cause a headache for the home owner. Such problems, if widespread in a city, will undoubtedly reduce the liveability of the city. Housing affordability is an important factor to consider when evaluating the liveability of a city, because not having a roof over your head is a serious problem. However, we also have to be mindful of other factors that determine the quality of life.
References
Demographia (2015). 11th Annual Demographia International Housing Affordability Survey 2015: Ratings for Metropolitan Markets. Accessed 14 November 2015 from http://www.demographia.com/dhi.pdf.