
To assess least-cost paths for a specific species, ‘Linkage Mapper’ must use a resistance raster. Each cell in the resistance raster must have a value which indicates the energetic “cost” (i.e., difficulty or risk of mortality) of moving across that cell. Normally, consultations with expert biologists would be carried out in order to assess which environment types would constrict species movement. For this project, we used available scientific literature as well as our own knowledge of ecology to determine which factors would most affect wolf movement and determine least-cost wolf corridor paths. We used the same five factors as those used for the wolf habitat suitability raster, but weighted them very differently. Linkage Mapper requires a GRID floating point raster, with 1 representing ideal habitat, and a maximum value of at least 100 representing the most resistant area. We found that the ‘Linkage Mapper’ tool would only work properly if the mean value was in the bottom (most ideal) 20%, i.e. extremely skewed towards low-cost areas with a few extremely high-cost areas. For example, the ‘Linkage Mapper’ demo resistance raster went from 1 to 2198, and had a mean value of 53. In the example, extremely high-cost areas were main roads and cities.
To create our resistance raster, we conducted a weighted sum, with very high values representing ideal habitat. We reclassified the main roads and buffered municipalities layers with opposite Boolean values than previously so that we did not need to use negative weights. The following table shows the weights used for each factor:
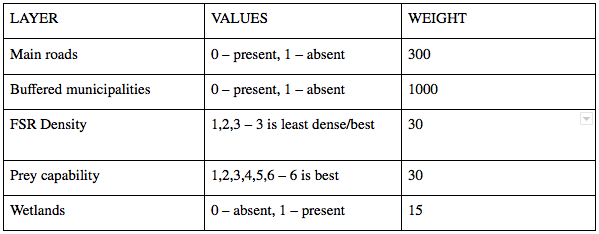
Table 1. Raster layers and weights used for resistance weighted sum calculation.
As shown above, prey capability was given a higher relative weight than FSR density or wetlands, and all areas located outside of municipalities and main roads were given very high weights. The raster created using this weighted sum was then inverted using the ‘Raster Calculator’ tool, with the query ((WEIGHTEDSUM – Maximum value)*-1) + (Value required for minimum value to be 1, in our case: 1). This created the following resistance raster (Figure 5), with a minimum of 1 (black, least resistant), maximum of 1533 (white, most resistant), and mean value of 202:
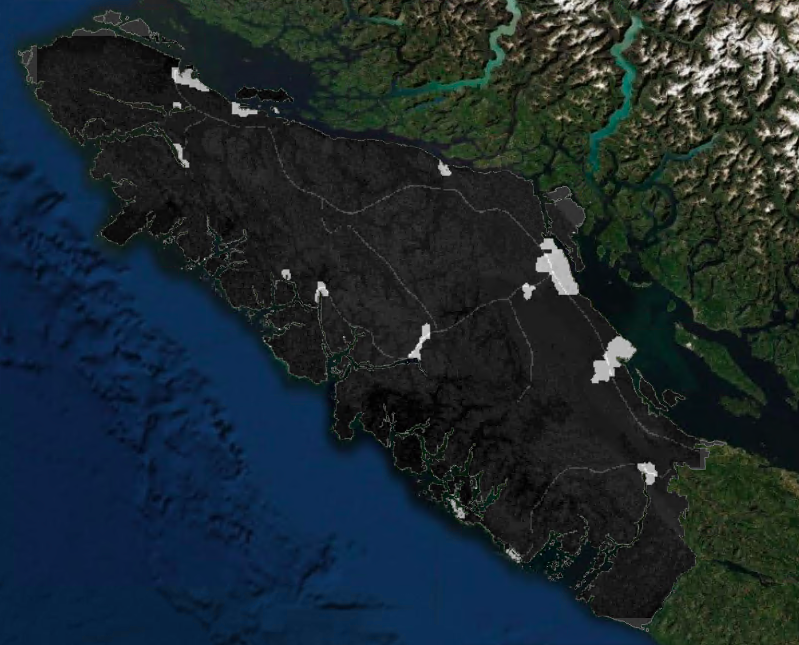
Figure 5. Resistance raster for Vancouver Island wolf movement. White/lighter shades indicate highest resistance (highest energetic cost of a wolf to move through these areas), and black/darker shades indicate lowest resistance (least energetic cost of a wolf to move through these areas). This resistance raster will be used to find least-cost paths for the wolves between the core habitat areas.
To fully prepare the resistance raster for the ‘Linkage Pathways’ tool, we converted the raster to floating point using the ‘Float’ tool, and exported the data in GRID format with a cell size of 400. It is unfortunate the loss of data that occurred converting it from a cell size of 100 to 400, but the tool would not run properly otherwise.