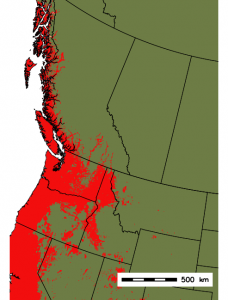
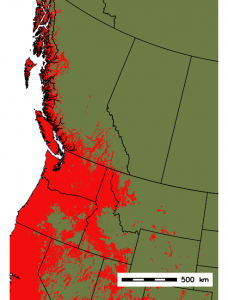
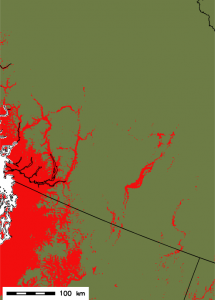
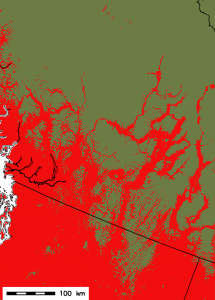
Note that for all species distribution maps, red indicates presence of A. macrophyllum unless otherwise stated in map legend.
-
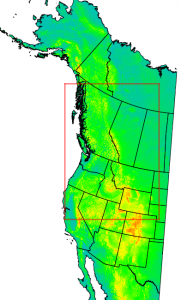
- Study Area
-
- Randomly generated “Pseudo-Absence” sample for training
-
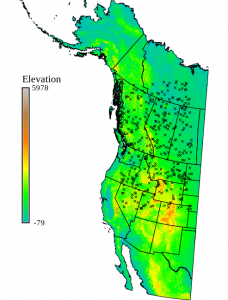
- E-Flora point data used for training
-
- Low Emissions Scenario — 2080
-
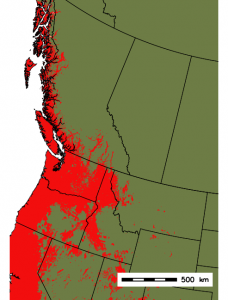
- Low Emissions Scenario — 2080
-

- High Emissions Scenario — 2050
-
- High Emissions Scenario — 2080
-
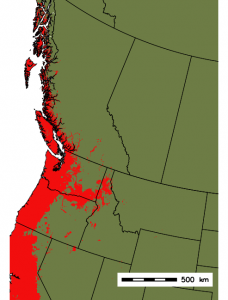
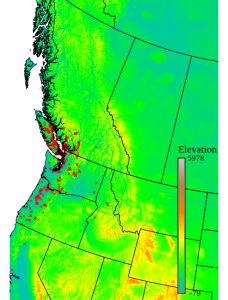
- Present Day Modelled Distribution
-

- Moderate Emissions Scenario — 2050
-

- Moderate Emissions Scenario — 2080
-
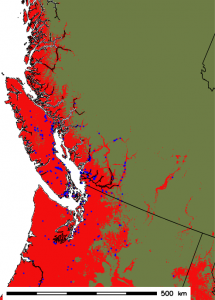
- Modelled vs. Observed Distribution
-
- Present Day Modelled Distribution — Southern BC
-
- 2080 Moderate Emissions Scenario — Southern BC
-
- Dispersal under moderate emissions scenario
-
- Range increases in southern BC under moderate emissions scenario
-
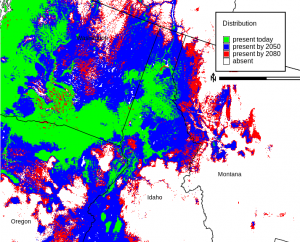
- Range increases in the northwest US under moderate emissions scenario
-
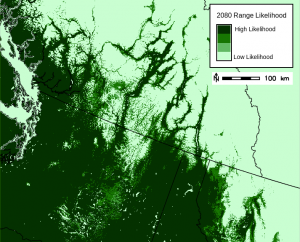
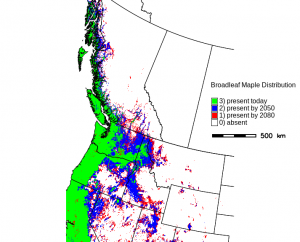
- Likelihood of presence by 2080 based on 3 climate scenarios
-
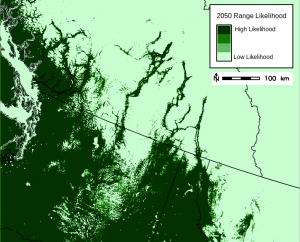
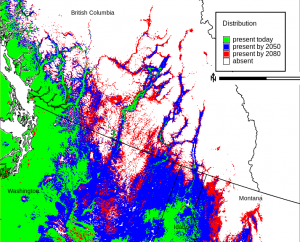
- Likelihood of presence by 2050 based on 3 climate scenarios
-
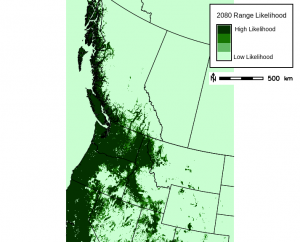
- Range Likelihood by 2080: Darker green is where presence is predicted under all three scenarios
-
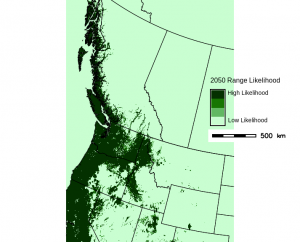
- Likelihood of presence by 2050: darker green is where presence is predicted in all three scenarios
Maps were produced by Carla Urquhart with GRASS GIS 7.4 and data from ClimateWNA and E-Flora BC. All maps projected with Lambert Conformal Conic and WGS 1984.