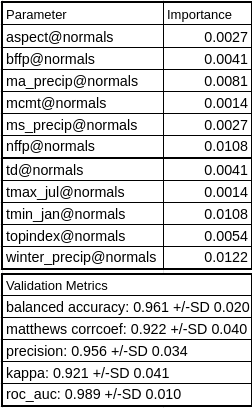
As indicated by Culver et al. (2007), the parameters selected by the algorithm in the initial test stages did reflect established knowledge about habitat needs of A. macrophyllum, with many of the variables representing winter conditions and overall wetness, which are key habitat considerations for this species (Fryer, 2011). In the final model, the most predictive inputs were the number of frost-free days (nffp), minimum January temperature (tmin_jan), and winter precipitation (winter_precip). Culver et al. (2007) also note that unlike other models that use one variable as a proxy for a set of collinear variables, random forest tends to spread out predictive reliance across correlated inputs, which is also reflected in this model’s behaviour.
The GRASS implementation of random forest offers a number of validation metrics based on k-folds cross-validation. One of the most commonly used metrics in assessing accuracy of species distribution models is the area under the receiver operating characteristic curve (AUC) (Mi, et al., 2017). The AUC can provide a more representative metric than typical accuracy measures when the class quantities are unbalanced. This is important in species distribution models as often the quantity of “absent” cells is often much higher than those where the species is predicted to be present. The AUC metric is a value between zero and one, where higher values reflect higher model accuracy. In this case, the AUC value was 0.989 with a standard deviation of 0.01, which is similar to other studies that used random forest for ecological modelling (Cutler, et al., 2007; Evans, et al., 2011; Garzon, et al., 2006; Mi et al., 2017). Evans et al. (2007), however, caution against a reliance on the AUC statistic and recommend comparing AUC to other accuracy metrics, particularly the kappa statistic which is another commonly used metric in ecological modelling (Barnard et al., 2019; Evans et al., 2007). If we consider both metrics, the accuracy of the model is between 92-98%.