In order to visualize how the data is present throughout the city I created a short animation as seen below. If not present please turn on closed captions for the best viewing experience.
As well as creating an animation I developed 5 maps in total. Four of the maps were used to show how the kernels were individually present throughout the city. While the fifth map was created in order to show the kernels stacked on top of each other (though order did slightly influence the vibrancy of certain colors it was negligible). When examining the maps it will appear that kernels are outside of the boundary of the city. Though this may seem incorrect, I chose to not clip to the extent of the study area as I decided that in a realistic situation the activity spaces and densities of variables do not end immediately at a city boundary.
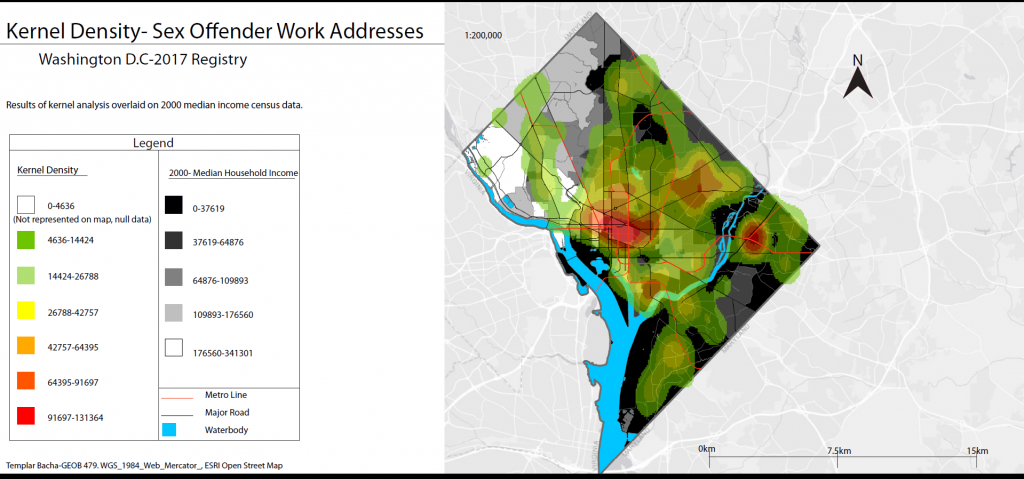
Map 1-Kernel of work addresses.
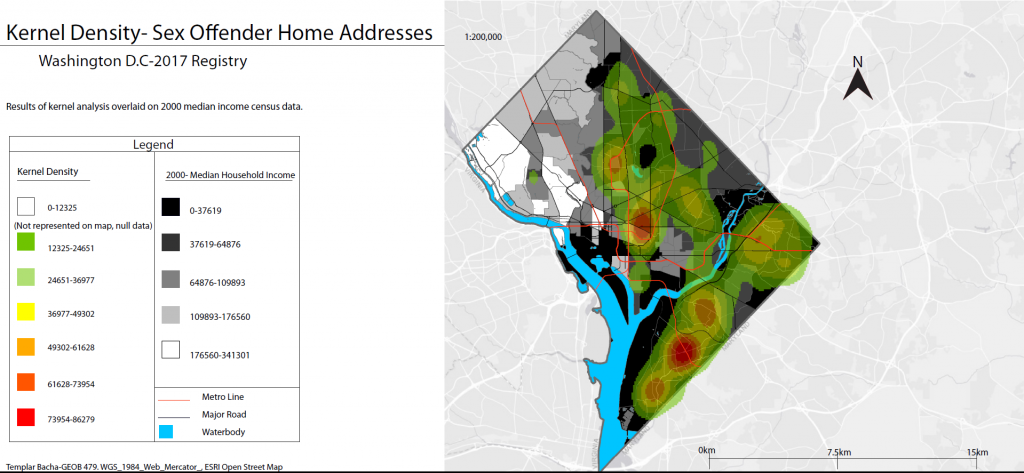
Map 2-Kernel of home addresses.
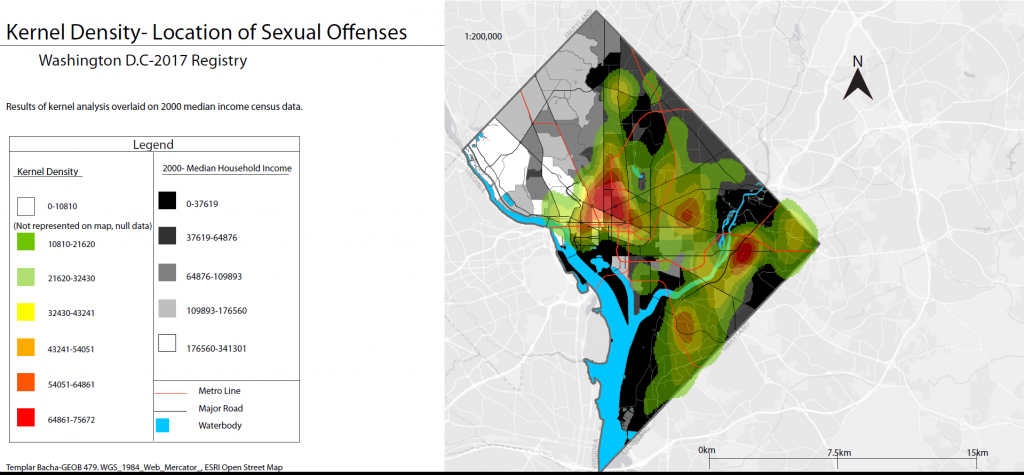
Map 3-Kernel of sexual assault crimes.
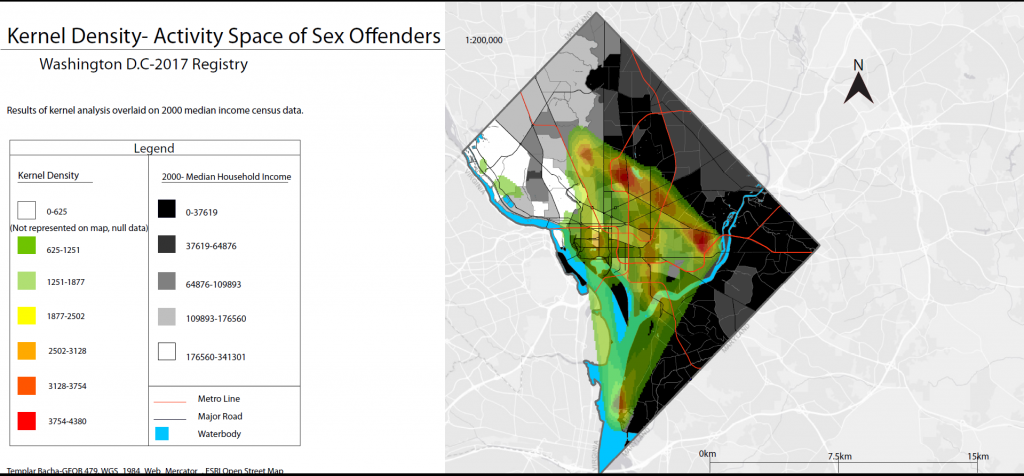
Map 4-Kernel of sex offender activity space.
Map 4 PDF

Map 5-All kernels overlaid with Local Moran’s I