
27 January 2017
In this lab we used a computer software program called FRAGSTATS to explore land-use change that took place in Edmonton, Alberta between 1966 and 1976. The analysis was conducted from the perspective of a landscape ecologist concerned about the effects of habitat fragmentation on biodiversity. Canada Land Use Monitoring Program (CLUMP) data was processed using ArcGIS to determine land use change. FRAGSTATS was then used to compute landscape metrics for the analysis. It was concluded that the positive effect of the observed increase in Productive woodland and Total core area is negated the by an increase in Total edge and Disjunct core areas.
This lab was definitely a lot more involved compared to other labs that I have completed in previous GIS courses which made the lab both challenging and fun at the same time. The key skills and take-aways I got from this labs were:
- What FRAGSTATS is and how it is used to compute landscape metrics.
- What landscape metrics are and how they are used in analyses.
- What a transition matrix (figure 1) is and how it is used to summarise and present data.
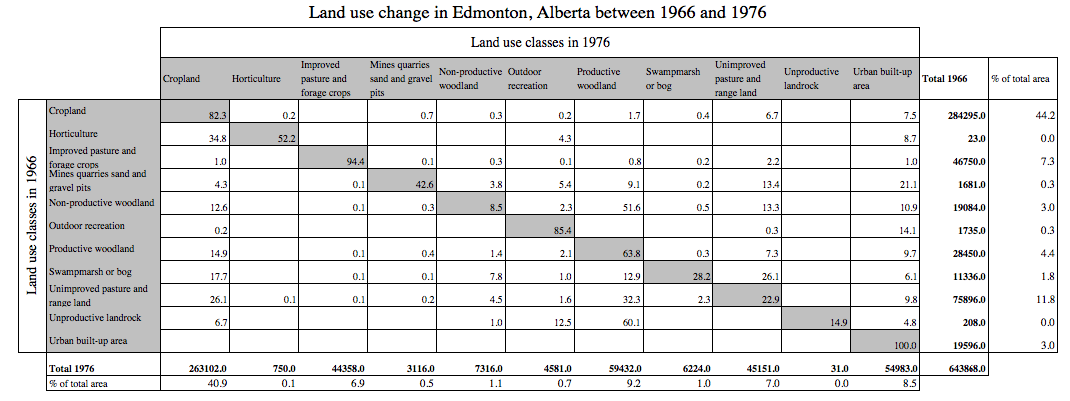
Figure 1. Transition matrix for Edmonton land use year 1966 and 1976.
Click here to see one of the maps that was created for the study. The map highlights the fragmentation of productive woodland in Edmonton as a result of the urban development that took place between 1966 and 1976.