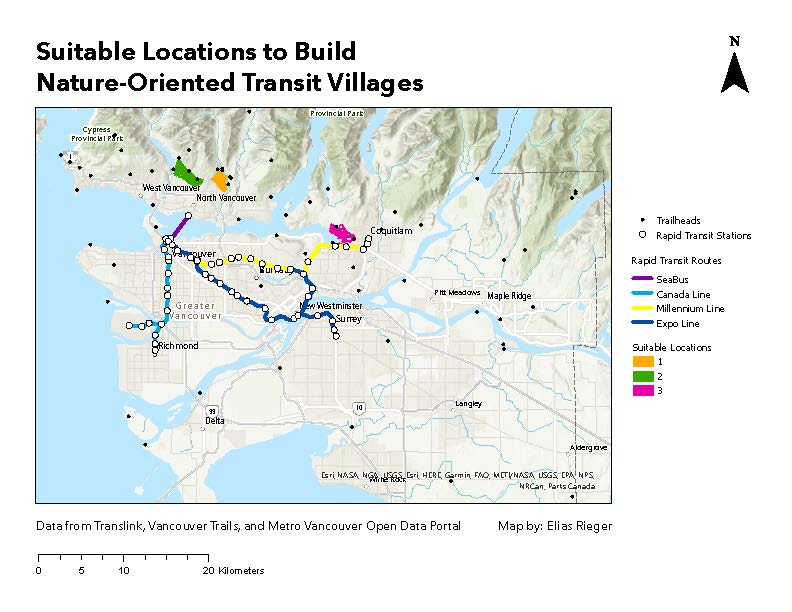
The Suitability Modeler located three areas where NOTVs could be built. Interestingly, all three of the spots were along the North Shore Mountains, two in North Vancouver and one in Port Moody. Even though there were trailheads throughout the region, these locations were likely chosen because of the higher concentration of trails. Furthermore, they all are relatively close to rapid transit stations, including the Lonsdale Quay SeaBus terminal in North Vancouver and Inlet Centre in Port Moody.
Click here for a full-sized map.
A visual analysis suggests that the Port Moody location has better transit access but fewer trailheads, while the North Vancouver locations have worse transit access but more trailheads. Given that transit access can be improved by simply increasing frequency and implementing transit priority measures, while creating more hiking trails involves the modification of potentially sensitive ecosystems, one could assert that it is relatively easier to improve transit. Taking this assumption into consideration, the North Vancouver locations might be preferable. However, more research on the social costs of transit and hiking infrastructure improvements would be required to make this conclusion.
Urban Containment Boundary Interpolation
One potential source of error in this analysis is the interpolation of the modified urban containment boundary. Depending on the method of interpolation, one could end up with completely different edges for the Metro Vancouver region. There is the possibility that some locations on the edge that I used would not be good locations for a NOTV. For example, Tsawassen was included in the edge in this analysis, however it is surrounded by farmland on the North side, the US-Canada border to the South, and ocean to the East and West. On the other hand, there could’ve been areas on the edge of the original urban containment boundary that were lost in the aggregation process. It is possible that some of these areas would have been suitable for a NOTV. That being said, all three of the locations that were selected in the suitability modeler are areas that are clearly on the edge of the region, with the city on the one side and forest on the other.
A More Sophisticated Model for Distance to Transit
One way that the analysis could be improved is by using a more sophisticated measure of access to transit. Since I used Euclidean Distance, there could have been spots that showed up as being very close to a rapid transit station, when in reality, it would take very long to actually traverse that distance on a bus. For example, if a location is directly across a body of water from a rapid transit station with no bridge, then a bus route would have to take a long way around to reach the station. A more accurate, but very time-consuming approach would be to set up a network model of the TransLink network using publicly-available General Transit Feed Specification (GTFS) data. Using this, one could calculate polygons that represent the travel distance from rapid transit stations. These polygons could then be converted to a raster layer to use in the suitability model. Nonetheless, all three of the locations that were selected in my analysis seem to have clear paths to the closest rapid transit station, indicating that the simpler Euclidean Distance method is sufficient in this case.
Sensitivity Analysis
Sensitivity Analysis is one of the most important components of a multi-criteria evaluation. Given that my initial model weighed both factors at 50%, I sought out to do sensitivity analysis at 60% – 40% and 40% – 60%. Unfortunately, after several hours of troubleshooting, I was unable to run the model without crashing ArcGIS Pro. This goes to show that software is an essential component of Geographic Information Science. If the software isn’t working, this can make it incredibly difficult to achieve the results that you want, no matter how good your data and model is.
In a model that weighs trailhead density at 60% and distance to rapid transit at 40%, I suspect that the results would stay relatively stable, given that the locations chosen in the 50% – 50% model were already those with the highest trailhead density. Therefore, weighing this factor even more should only solidify those findings. It’s more difficult to say what would happen if trailhead density was weighed at 40% and distance to rapid transit at 60%. One possible location that might be selected in this model is in Coquitlam. Although the trailhead density is not very high here, it appears to be the closest that a rapid transit line gets to the edge of the region.