This week we had presentations on journal articles related to health geography. The article I chose is called Mapping Risk of Plague in Qinghai-Tibetan Plateau, China (link). I chose to look at an article related to the Plague because it’s interesting how such a devastating disease from the past is nearly forgotten by most people, but it is still occurring in many places and can be deadly if people have no immediate access to antibiotics. The objective of the article was to map risk of Plague by examining the distribution of its host, the marmots.
The methods are not over-complicated as seen below:
1) Ecological Niche Modelling
– Use infected marmot data and environmental variables to create Plague probability map
– Use Maxent program to train 75% of presence data, and test accuracy with remaining 25%
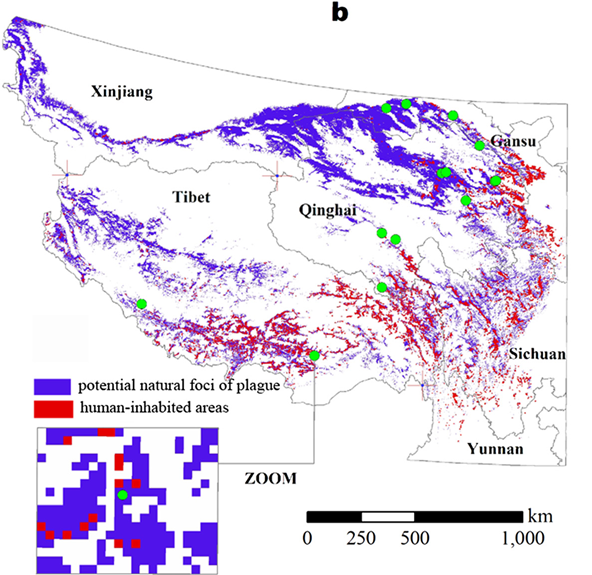
2) Human Risk Assessment
– Calculate optimal probability cut-off point, pixels with values higher than cut-off point predicted to have Plague
– Overlay with human distribution data to determine at-risk areas
Map:
Overall I felt this was a pretty good article, with statistically significant results and through explanations. The authors also discussed a lot of limitations to the method. One thing they didn’t address that I felt was important was the difference between enzootic infections (longer periods of low infection rates) and epizootic infections (rare and short periods with very high infection rates).
There were many interesting articles being presented with various kinds of objectives. For example one article looking at relation between travelling time to health centres and heights in Rwanda showed that the closer homes are to health centres, the taller people are. This relates to the topic of inequality that we talked about in previous classes, and in this case people with better access are likely to be healthier (with height as indicator).