Solar Energy MCE methodology:
The factors considered in our solar energy MCE included:
- Distance from transmission lines
- Advised against areas
We used the same advised against areas and distance from transmission lines layers as before.
- Slope
Our slope raster was derived from our DEM using the slope tool. Since we’re interested in flat areas on Haida Gwaii, we used the Set Null tool to set all slope values greater than 3 degrees equal to NoData. We did this is because large solar farms are generally built on flat landscapes. Next, using the raster calculator (with the equation given below), the layer was normalized so that low slopes close to zero were given the highest scores.
Normalized Slope = (3 – reclassified_slope) / 3
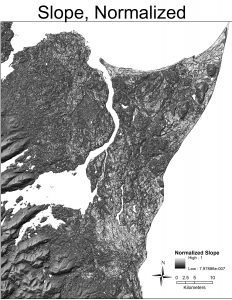
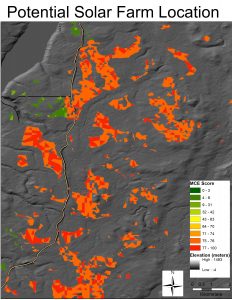
We were not able to include a solar energy raster layer as a factor in our solar energy MCE because we did not one; we had to create our own solar energy raster layer using the Area Solar Radiation tool in ArcMap. This tool analyzes an inputted DEM for the total amount of solar energy received at each raster cell over a period of time. Because our DEM file is ~500mb, running the Area Solar Radiation tool on our entire DEM would take a significantly long time. For that reason, we were not able to factor in a solar energy raster layer as a factor in our MCE. Instead, we would proceed with our MCE using the three factors listed above and then run the Area Solar Radiation on small clipped areas of our DEM which included areas that scored high in the MCE.
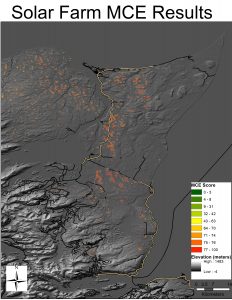
The weights used in the subsequent weighted overlay of these three layers are listed below. Similar to our wave and wind MCEs, avoiding the advised against areas was the most important factor in our solar MCE.
| Solar MCE Factor | AHP Score / Weight |
| Advised Against Areas | 0.6854 |
| Slope | 0.2344 |
| Distance From Transmission Lines | 0.0802 |
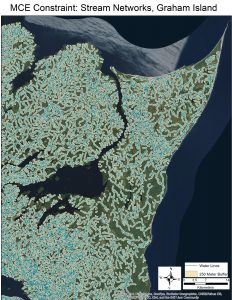
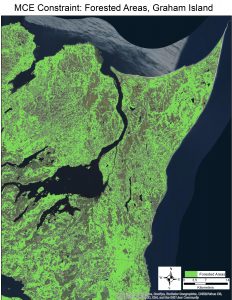
For a solar farm to be built on Haida Gwaii, it would have to completely avoid not only the protected areas outlined in our constraints map, but also the large amounts of forested and vast network of streams that exist throughout Haida Gwaii. To account for these additional constraints, our vegetation and wooded areas layer, we selected the polygons corresponding to forested areas and created a new layer from this selected. Next, we added a 250 meter buffer to the water lines layer so that our MCE results would not be in close proximity to existing streams on Haida Gwaii.
Finally, from the results of our MCE’s weighted overlay, we convert the raster into a polygon layer and then erased all areas containing water bodies, forested areas, and protected areas.

