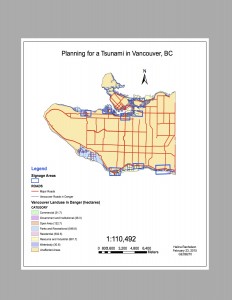
- Employed various Analysis Tools such as Overlay and Extract under ArcToolbox to create layers of health and educational facilities and road infrastructure, create summary tables, calculate statistics (area and length) for areas that would be affected by a tsunami
- Indicated signage points (spatial and tabular data) based on these statistics on a map to highlight Vancouver’s neighborhoods most at risk.

Through my GIS analysis for Lab3, I discovered that approximately 15% of the city of Vancouver’s total area is at risk of tsunami damage. To arrive at this percentage, I went to ArcToolBox> Analysis Tools> Overlay> Intersect and created a layer called Vancouver_Danger from Vancouvermask (total land surface) and Danger (area affected by tsunami) layers to show the land surface in the city that would be in danger in the case of a tsunami. Under the attribute table of Vancouver_Danger, I took the total area value and then divided this by the area value for Vancouver Mask (also found in its attribute table) to get the percentage.
In addition, by using the same overlay tool as in the previous step, I combined the Vancouver danger zone layer with Vancouver health and education layers to find out the potentially tsunami-affected areas for the health and educational facilities. By visiting the attribute tables of each> Summarize, I created a sum table, and I found that the following health and education facilities in the city to be at risk of a tsunami:
Healthcare facilities: False Creek Residence, Broadway Pentecostal Lodge, Yaletown House Society, Villa Cathay Care Home
Educational Facilities: St. Anthony of Padua, Ecole Rose des Vents, Heritage 3R’s School, Vancouver Montessori School, False Creek Elementary, Emily Carr Institute of Art & Design, Henry Hudson Elementary, Institute of Indigenous Government