Suggesting Potential Cooling Centre Locations
From the vulnerability map with cooling centre buffers, we can suggest potential locations for cooling centres. Zooming in will help us visualize this. Criteria for a potential location include high vulnerability and not within the range of a cooling centre buffer.
These suggested locations can help with future urban planning. For instance, existing infrastructure in at-risk locations could be equipped with air conditioning if not already. Future community centres and libraries could be built in at-risk locations.
Of course, urban planners would need to consider more factors, such as population density and costs of construction and maintenance to optimize benefits to the community. We are suggesting locations based on composite indicators for heatwave risk from a GIS perspective.
Vancouver and the North Shore
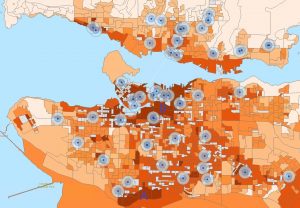
Location A: Another cooling centre in Marpole, near Marine Drive in the South near the Fraser River.
Location B: Downtown Eastside has many cooling centres but there is an area not well covered in Mt. Pleasant.
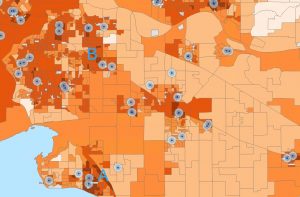
Location A: There is one very vulnerable area in White Rock that could benefit from a cooling centre.
Location B: Areas of Surrey could have better cooling centre coverage.
Burnaby, New Westminster, Coquitlam and Maple Ridge

Locations A, B, C, D and E: The communities with the highest vulnerability class and are far from any cooling centre are indicated on the map.
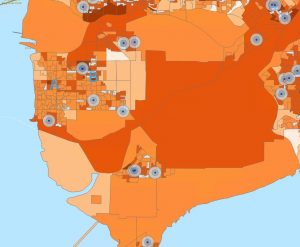
Locations A and B: Communities in Richmond that have high risk but are distant from cooling centres.
There is a large area of Delta with moderate risk and no cooling centres, but this area does not have a large population, so whether the area is in need of a cooling centre requires further study.
Limitations
The temperature data that we obtained from CANUE was for the year 2015. This was the most recent dataset we could obtain. A limitation is that weather events differ from year to year. Also, the temperature data is the Annual Average of Daily Maximum Temperature, so it takes into account climate phenomena other than summer heat domes. But nevertheless, the data gives a good representation of the temperature trends due to factors such as elevation and proximity to the ocean.
Another limitation was the lack of availability of air conditioning and health data, which we were initially searching for. Air conditioning and health data were available on a provincial scale but were not geographically detailed enough for our purposes. So we searched instead for composite indicators such as the age of buildings and census variables that were shown in previous studies to be correlated with health and air conditioning. A potential pitfall of this approach is the ecological fallacy, which is attributing the properties of a group to an individual. Every individual has a different health background, and respond differently to heat-related stress. It is very difficult for a model to take all these factors into account.
We were originally planning to analyze the age of buildings using BC Assessment Data, because we were looking for an indicator for air conditioning. We obtained access to the data through Abacus, thanks to the help of Jeremy Buhler, a GIS librarian at the UBC library. We found out that the data only covers single-family homes, and not any apartments. We decided not to use the BC assessment data because it was incomplete for our purposes.
There are many potential air-conditioned buildings that we have not yet considered. For instance, some supermarkets, retail stores and malls have air conditioning, but there is no data to show that they do. And since they are private property, not everyone can access them.
Future Directions
Our map of the cooling centres for Metro Vancouver is a novel one. There was an interactive cooling centre map for Vancouver but not the surrounding municipalities such as Burnaby, Surrey, Richmond and Coquitlam. Our list classifies cooling centres as community centres and libraries. It is by no means an exhaustive list but provides the major points. As a future project, we could make this map accessible to the general public, and raise awareness about the dangers of heatwaves. Our models and maps could be useful for organizations that help with pre-heatwave planning and heat responses in vulnerable communities, such as the distribution of educational materials and first aid training (Rinner et al, 2011).
Please see our “Cooling Centres” page to view the public map, which is currently in its preliminary stage. At the moment, users can click on any point to identify the name of a cooling center. All cooling centers that were mentioned in the news or by Vancouver Coastal Health or Fraser Health during the 2021 heat wave are included. In the future, we plan to update this map to include the full address and opening hours of each cooling centre. In addition, during a heatwave, this map would be updated to include any pop-up centres, and allow organizations to add their cooling centres to the map. One of the factors which contributed to the 2021 heatwave was that there was a lack of public awareness that these cooling centres were available.
We could extend our framework to include more variables related to heatwaves such as the urban heat island effect and urban canyons, which we have not taken into account in our analysis. With access to measuring equipment such as temperature sensors, this could be done.
We could look at locations other than Metro Vancouver. Since climate change is a global issue, many cities around the world need to be prepared for future heat waves.