Selecting Vulnerability Factors
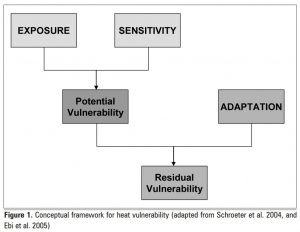
We utilized a framework suggested by Rinner et al. (2010) and Yu et al. (2020), which defines the potential vulnerability as combining the two factors:
- Exposure – characteristics of the landscape and climate which increase temperature experienced by people in an area
- Population Sensitivity – characteristics of the people living in an area which increase their risk of heat related death or illness, with risks prior to any mitigation activities
We then took into account the adaptive capacity, which is the interventions that reduce potential vulnerability. The framework flowchart is shown below (Rinner et al, 2010).
We conducted a literature review to identify factors which are correlated to heat related illness and death. More factors were identified than were used in this study. The factors which we decided to use were those that we had access to reliable data on for Metro Vancouver, and that were most frequently cited as being correlated to heat related illness and death.
Based on the importance highlighted from previous research and availability of data, we selected the following variables for the following reasons:
Exposure
- Temperature: Higher temperatures are related to higher risk of heat-related illness or death. A global study of 64 cities found that there is a 1-3% mortality increase for every 1 ̊C increase in maximum temperature (Hajat & Kosasky, 2009). Moreover, cities with moderate climates (such as Vancouver) are more vulnerable than cities with pre-existing hot climates, due to a lack of acclimatization to higher temperatures (Rinner et al., 2011).
- Canopy Cover: Greater percentage of canopy lowers heat exposure because vegetation provides shade and aids heat relief. In their Urban Forest Strategy, the City of Vancouver has identified a connection between urban tree coverage and land surface temperature, stating that the hottest areas in the city tend to have the lowest tree canopy, and that increasing the tree canopy would be a way to reduce the heat vulnerability of these locations (2018). Urban tree coverage was one of the key exposure factors used in the City of Toronto study (Rinner et al., 2011).
- Impervious Surfaces: A larger percentage of impervious surface increases heat exposure because pavement retains heat for a longer time than vegetation (imagine standing on a sidewalk vs. standing on grass on a hot day). The BC Centre for Disease Control found that the most deaths during the 2021 heatwave occurred in private residences that had less greenspace, more people living alone, and lower income levels (Human Rights Watch, 2021). “Access to greenspace” was used as an exposure indicator in the City of Toronto study (Rinner et al., 2011), however we chose to use ‘impervious surfaces’ instead, to include not just public greenspaces but also any other vegetation, such as lawns and gardens, which contribute to cooling through transpiration.
Population Sensitivity
We assessed population sensitivity based on factors that correlate to health outcomes and/or in-home air conditioning. Building-specific data on air conditioning was not available, so instead we used other factors which were shown to correlate to having air-conditioning in a 2011 study done by Toronto Public Health.
- Age: Older people are more likely to have heat-related illnesses and are less able to seek medical attention. According to the BC Coroners Service, 79% of British Columbians who died during the 2021 heatwave were 65 years or older (Human Rights Watch, 2021). In a study by Reid et. al, the ‘proportion of elderly population’ was one of the 4 factors which accounted for 75% of the variance in heat vulnerability (2009).
- Living Alone: People living alone are less able to seek medical attention, or have a support system to check in on their health. The BC Centre for Disease Control also identified that most deaths occurred in private residences where people lived alone (Human Rights Watch, 2021). Social isolation was identified as another one of the 4 factors which accounted for 75% of variance in heat vulnerability in Reid et al. (2009). Toronto Public Health also found that “the incidence of in-home air conditioning is higher in households with 2 or more people, specifically two or four, than single person households (89% vs. 79%)” (Gower et al., 2011).
- Income: The incidence of having in-home air conditioning is significantly higher in households earning more than $20,000 per year than households earning less (Gower et al., 2011). In addition, a study done by Johnson et al. found that variation in heat vulnerability could not be accounted for solely with temperature data, but could be accounted for when socio-economic data was included (2009). The BC Centre for Disease Control also identified that most deaths occurred in private residences with lower income levels (Human Rights Watch, 2021).
- Rent: Those who own their home are significantly more likely to have air conditioning than those who rent (93% vs. 73%)” (Gower et al., 2011).
Overview of Analysis
Key studies that guided us in creating our analysis included:
- “Mapping spatial patterns in vulnerability to climate change-related health hazards” by the UBC School of Population and Public Health
- “Access to Cooling to Protect Health During Hot Weather” by Toronto Public Health
- “The Role of Maps in Neighborhood Level Heat Vulnerability Assessment for the City of Toronto”, a study done by Ryerson University
For our Multi-Criterion analysis, we used a suitability model, where higher suitability means a higher vulnerability and thus are more suitable areas for cooling centres.
We decided to conduct a suitability analysis for each factor (exposure and vulnerability) separately. Then we conducted another suitability analysis combining the two factors.
Exposure: Temperature, Canopy Cover, Impervious Surfaces
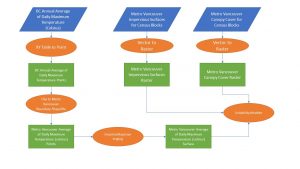
The temperature data was given in a tabular format, which was imported into ArcGIS. Since latitude and longitude were given with each of the points, the XY Table to Point function was used to convert into point data. Since this data was for all of BC, the data was clipped to the Metro Vancouver Dissemination Areas shapefile.
Then, spatial interpolation of the point data was done with Empirical Bayesian Kriging on ArcGIS. This resulted in a temperature surface that had the general trend of increasing inland.
The Canopy and Imperviousness data was given as a vector layer for census blocks. Canopy and Imperviousness were separated into two layers, and then the vector was converted to raster form via the Feature to Raster tool on ArcGIS.
The weights were determined on 123AHP. Temperature is significantly more important than impervious surfaces and canopy cover because it is a more direct measure of exposure. Impervious surfaces and canopy cover are assumed to be equally important.
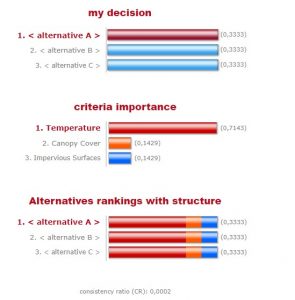
Using the suitability modeler on ArcGIS, we used the large and small transformation factors. The large transformation factor is used to indicate that large values are more suitable, and the small transformation factor is used to indicate that small values are more suitable.
| Factor | Percent | Transformation |
| Temperature | 70 | Large |
| Impervious Surfaces | 15 | Large |
| Canopy Cover | 15 | Small |
Population Sensitivity
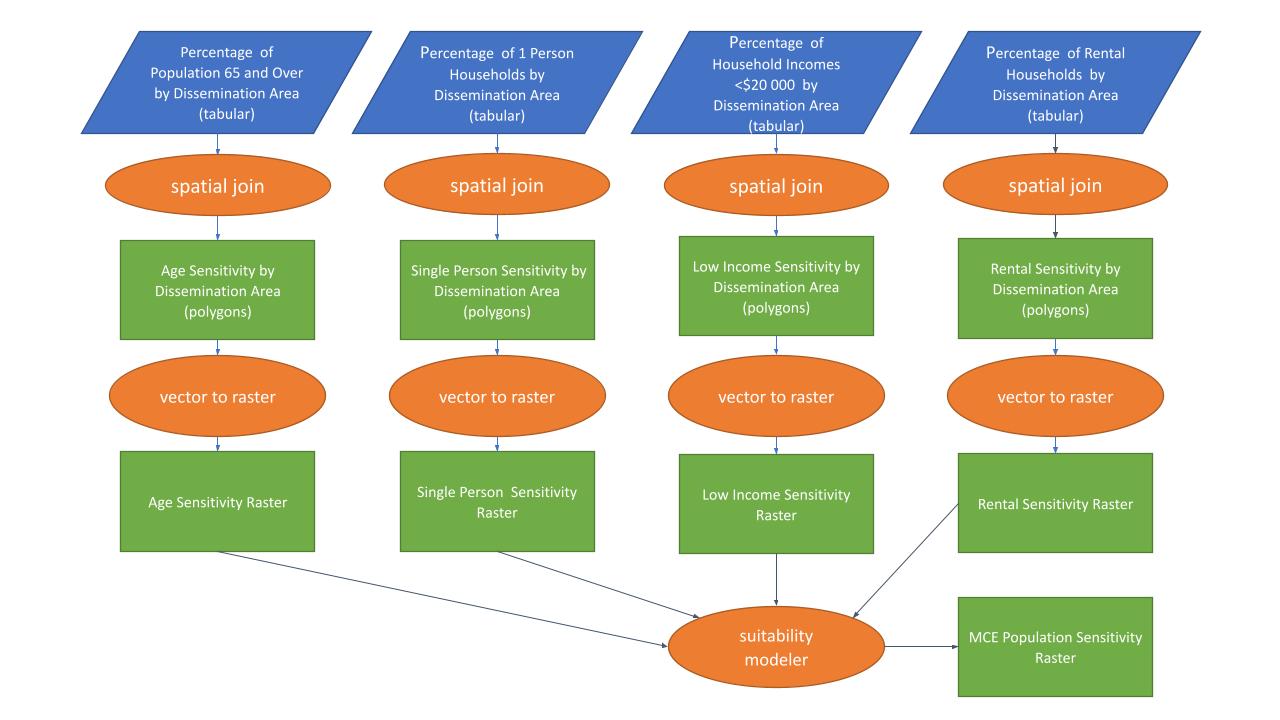
Weighted analysis: ‘Age’ and ‘single person’ were weighted to be equally important. ‘ Low income’ and ‘rent’ were weighted to be equally important. Age and living alone were significantly more important than income and rent because they are directly related to health outcomes, whereas income and rent were indirectly related, as they are predictors of whether or not a household has air conditioning.
Using the suitability modeler on ArcGIS, we used the large and small transformation factors. The large transformation factor is used to indicate that large values are more suitable, and the small transformation factor is used to indicate that small values are more suitable.
| Factor | Percent | Transformation |
| % Population > 65 years old | 35 | Large |
| % Single-person households | 35 | Large |
| % Household incomes under $20 000 | 15 | Large |
| % Renter households | 15 | Large |
Final Multi-Criterion Analysis
Two suitability models, one weighted and one equal were made.
The weighting we used in the individual factor (exposure and population sensitivity) MCE was combined. In our model, we decided to focus the weight on exposure. Exposure was weighted at 70% while population sensitivity was weighted at 30%. The weightings within exposure and population sensitivity were kept the same, and multiplied by the category weighting.
| Factor | Weighting (%) | Transformation Factor |
| Temperature | 49 | Large |
| Canopy Cover | 10.5 | Small |
| Impervious Surfaces | 10.5 | Large |
| Age | 10.5 | Large |
| Living Alone | 10.5 | Large |
| Income | 4.5 | Large |
| Rent | 4.5 | Large |
For the equal weighting, each factor was assigned a weight of 100/7 = 14.29%.
Creation of Buffers for Adaptability
Presently, there is no publicly-available singular map of all cooling centres accessible to the public in Metro Vancouver. To create the cooling centres map, we compiled data from the City of Vancouver, Vancouver Coastal Health, and Fraser Health, as well as referenced news articles from the 2021 heat wave. These points were located on the map, and then we added both a 400 m and 800 m buffer, to visualize 5-minute and 10-minute walks (respectively) from each cooling center.