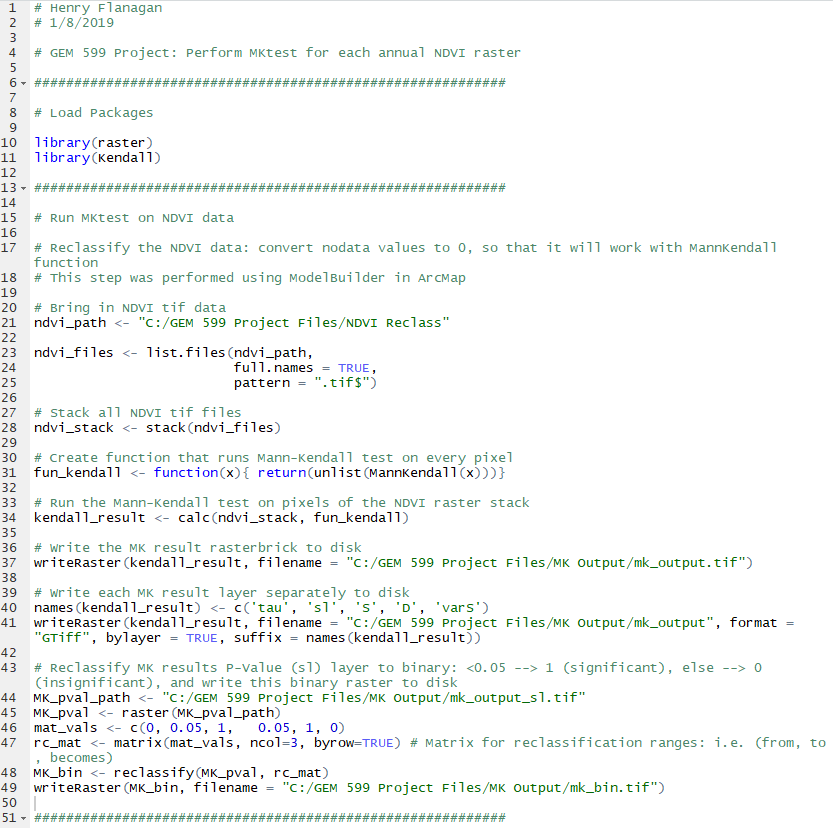
After deriving NDVI for each yearly Landsat composite covering my study area, I took several steps to determine where there was a greening (increasing NDVI) and browning (decreasing NDVI) trend. I masked out pixels that had experienced disturbance such as fire and harvest, as well as pixels that contained water. For the remaining pixels, I used Rstudio to perform the Mann-Kendall test on each pixel time series (i.e. a list of the pixel values throughout every year for which I had data). This test returns the probability that their is a monotonic upward or downward trend in a time series, so I used it to assess which pixels had a statistically significant trend in NDVI. The following image shows the R code I wrote to accomplish this task:
I then calculated Sen’s slope for each pixel to determine the average yearly change in NDVI for each pixel. This allowed me to assess which pixels with a significant NDVI trend were greening (positive trend) vs browning (negative trend).