October 2015

GIS Midterm Accomplishment Statements

In the 3 labs on GIS we have currently completed I have accomplished a number things that reflect the skills I have learned through different analyses scenarios.

  1. Used remotely sensed landsat data in the geographic analysis of the Mt. St. Helen’s volcano eruption to create a model that shows the event’s effects and the current recovery process.
  2. Constructed a complex tsunami risks map for the city of Vancouver by using and combining a wide array of datasets to identify specific points of interest to focus relief efforts on.
  3. Learned the various tools of GIS to modify data and create layers to project a map that takes a broad set of data and focuses them towards expressing a common goal. The end result is the ability to create a map that is easily understood and tells the audience of the goals of the project.

GIS Lab 3 – Planning for a Tsunami in Vancouver

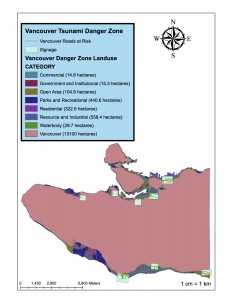
In our third lab about constructing a map that informs the danger zones of a possible tsunami in Vancouver. In my findings I determined that 11.35% of Vancouver’s total area is under danger as show in this map of Vancouver’s tsunami danger zone.

Map of Vancouver's Tsunami Danger Zone

With the data for the lab here is how I was able to calculate that total area in danger percentage:

First I looked at the total area of Vancouver by opening an attribute table for the Vancouvermask layer and looking at the Shape_Area value. Then I added a new field to the table and changed the field calculator to get the area from m^2 to km^2 to simplify the numbers. I summarized the different landuse types that might be affected by a tsunami by categories and looked at each land use’s total area, also after converting it into km^2 from m^2.

Lastly I used the statistics tool in the attributes table to determine the total area of the land that may be affected by a tsunami and divided that by the area of Vancouver found in the previous question.

With the new map I had constructed I was able to identify the following health and education facilities in risk of being devastated by a tsunami.

Health Facilities in the Danger Zone Education Facilities in the Danger Zone
False Creek Residence Emily Carr Institute of Art and Design
Villa Henry Hudson Elementary
Cathay Care Home False Creek Elementary
Broadway Pentecostal Lodge St Anthony of Padua
Yaletown House Society Ecole Rose Des Vents

To get this list I went and used the Select by Location tool to find the health and education facilities in Vancouver that were found in the tsunami danger zone. From there I exported the selected facilities data into new layers called Education_Danger and Health_Danger. I found the specific entries by looking at the attribute table.


GIS Lab 2 – Understanding Geographic Data

As I had learned in our second lab, when using GIS data there can be misalignments and errors in the display of the information. As a result of more accurate methods of surveying the landscape we have older data that is not adjusted to these newer models. Often times when constructing maps we need to take data from a variety of sources and in doing so some of the data will not be in the same projection. This is where we start to see some data which becomes misaligned or improperly referenced. To fix the issue we must go through the metadata to look at the properties of the data and change the projection to a consistent type. Having a common projection allows the data to work seamlessly and using the metadata informs us of which projection will best represent the desired outcome.

One of the most important tool we learned about during our lab was the use of Remotely Sensed Landsat data. I saw first hand how it gave us the advantage of creating snapshots at different time intervals of an area that we can use to compare and show the changes in the environment. Landsat data has great potentials including mapping how an area restores itself after a devastation, how large scale development projects can affect the surrounding ecosystem and the effects of global climate change. All of these applications can help us make decisions about future conservation efforts, construction projects and recognizing areas that can have dangerous living conditions.

Intro to GIS Labs

Collected in this blog are some examples of the labs where we have received hands on experience using the GIS computer programs. We’ve learned about using GIS to create maps, how to properly use and display relevant data and various other ways to utilize and apply the tools provided for real world projects.

In our labs we have taken GIS training guidelines and have received our GIS Certificate.

I Am Steven Sy

I’m currently a third year student at UBC working on my Undergraduate Degree in Integrated Sciences. My focus will be to combine the following disciplines; Sustainability, Ecology and Economics alongside a Minor in Commerce as I feel that it is important both to protect the environment and to continue innovating as we look to the future.

Now a little bit about me: I’m a fan of the Vancouver Canucks, I like baking with my grandma and I’m obsessed with Suits.