December 2015

Professional Development Reflection

As an aspiring Environmental Scientist the progress of my understanding and knowledge of the Geographic Information Systems has been a tremendous highlight in the GEOB 270 course. It is my desire to one day assess areas of ecological importance and to develop methods of sustainable development and resource use with this knowledge. GIS has provided me with the foundation and tools to accomplish these goals and effectively present this information to my peers. This has been put into practice as we worked as a team to analyze the accuracy of the ALR in the Northern Rockies of BC.

-Steven Sy


Analysis of the Northern Rockies ALR in BC

Northern Rockies ALR Final Project

For our final project, our group’s goal was to assess the validity of the ALR of the Northern Rockies region in BC. It was our desire to determine how much of the proclaimed reserve was actually suitable for farming purposes and to inform the public of possible misuses of the land.

Teamwork was critical for the completion of this project as we broke up the workload into specific tasks at the beginning and I think that everyone played a key role in putting the final report together. James and MC both worked on the actual processing and collecting of the crucial data for our analyses, I worked at representing our maps in an informative and easy to understand manner while Patricia collected everything into a cohesive report that highlighted our findings. While everyone had their own roles to fill, it was really more of a collaborative effort as we all helped each other. There were many instance where we all worked together, often times informing one another about what we wanted to display and show in the final report. It was this cooperation that I believe helped us create a report that effectively showed the inaccuracy of the ALR.

In the process of working on the Northern Rockies ALR I learned some interesting details about the project and GIS in general. I learned the importance of proper data management, proper communication with my group members and how difficult it is to find a good way of representing our maps. There were a number of occasions where as we were all working on our individual parts from the same shared data drive and as a result of improper data handling procedures we ended up working on the same geodatabase and then when we moved them back we ended up erasing someones progress and lost some crucial layers. This led to a lot of retracing of steps and wasted time as we worked to fix the issues. Proper communication was also a big factor as keeping informative workflow notes helped to stop confusion when putting the final project together. Having the role of cartographer and mapping such a small area I understood just how difficult it can be in deciding what areas need highlighting, what symbology would best display our information without distracting readers and how to best highlight the area’s features. It was also important to find a way to use inset maps effectively to show the full range of our region as it was spread out across a wide area within a limited size page.

This project combined all of the skills we had learned to use in GIS by working as a team to analyze the Northern Rockies region and evaluate the accuracy of the ALR. Our communication and presentational skills were showcased as we combined our findings and maps of the area in a final report that would be published to the public.

GIS Final Accomplishment Statements

Through more experience with the GIS software and its various programs I was able to further build upon my existing knowledge base with accomplishments with the program.

4. Used different categorizing systems to classify the affordability of Vancouver housing data in various ways to reflect how the data would be interpreted by the reader.

5. Constructed an environmental assessment map to evaluate the validity of a ski resort being proposed in the Garibaldi area by using knowledge in the GIS program to process and analyze a number of data sources.

Garibaldi Ski Resort Environmental Assessment

Lab5Map - Legend_Mk2

To the Northland Properties and Aquilini Investment Group of Vancouver,


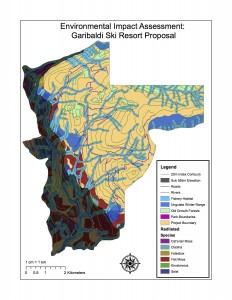
         The Garibaldi at Squamish projects is a proposed ski resort in the Brohm Ridge, which is 45km south of Whistler and 80km north of Vancouver. This environmental assessment reviews the proposed project’s merits and surveys possible locations for the site, taking into account the snowfall and the projects affects on vegetation, fish and wildlife habitat in the area. This assessment outlines the priorities the proponents need to focus on in order to proceed with the proposal. To analyze the data we gathered data from DataBC that mapped the Ungulate Winter Ranges as well as the Old Growth Management Areas. This information is crucial in identifying the key hotspots in the project area that require considerable environmental care. Additional data used in this assessment includes the project boundary, the Terrestrial Ecosystem Mapping data, Digital Elevation Model, Protected Parks, the roads and the rivers. Before analyzing, some of these layers require a change in projection to ensure that all of our data properly lined up with one another. These datasets were first cropped and narrowed down to the specific project boundary to analyze the project’s direct affects. Elevation was simplified into above and below 555m elevation categories to assess areas that would require equipment to produce snow. From the Terrestrial Ecosystem Mapping layer we selected the top species threatened in the area and created a map of the red-listed areas. Combining the elevation range along with the river layers we isolated the parts of the rivers that are below 555m of elevation. These areas are considered to be more likely to be fish bearing and should be given a higher priority when considering conservatory measures. To demonstrate the riparian areas that are essential for these fishing communities, buffer zones were made around these rivers. The above 555m elevation rivers were buffered by 50m on either side while below 555m elevation rivers were buffered with 100m on either side. These different layers provide a representation of the environmental areas of concern for the project. It was calculated that the combined percentage of the project area that consists of red-listed ecosystems (24.8%), ungulate habitat (.8%), old growth forests (6.8%) and fish habitats (30.1%) equaled 55.6%.


In our opinion, the two greatest environmental concerns to project development would be selecting a suitable area to build both the resort and the ski slopes. Ideally, the resort would be built along an already established road, but would not interfere with the ungulate habitats or old growth forests. Additionally the resort should avoid the riparian zones as runoff and pollution may be an issue. Ski slopes should also be located in areas that don’t interfere with the rivers and should receive lots of snow. Although a large percentage of the area represents the different sections for concern is important to consider that a large percentage of these hotspots fall below the 555m elevation level, with large areas of open land available at higher elevations. These areas would be well suited for the slopes and the resort. They would receive plenty of snow, and focusing on constructing in this area would mitigate any affects to the environment. With careful planning and consideration of the key environmental habitats, a ski resort can be constructed that has minimal affects on the environment, meets conditions for proper slopes and be easily accessible to the general public.


When evaluating the above project proposal that was drafted with the goal of supporting the Ski Resort in mind, I realized that my own personal views conflicted with what I was tasked with. While I do agree that another ski resort would be great for our economy and for local snowboarders and skiers, I feel that I don’t have the knowledge to fully support what was written in the memo. While it is evident that a large portion of the project area is at a high enough elevation to receive sufficient snowfall I’m not confident that there is enough open space in the area for construction of the slopes to occur without some damage occurring to the local environment.

Housing Affordability in Vancouver

affordability

As represented in this map, which displays the affordability of housing in Vancouver, affordability factors in not just the actual cost of the house but the income of the household. This index gives a better measure of affordability as it takes into account the percentage of their wages and shows whether or not they are able to pay the cost of the house with the money they have.

The affordability categories are broken into manual categories of specific values as designated by our lab coordinators. This representation was chosen to best represent the affordability of housing in Vancouver. While another ranking system would be best used to illustrate Montreal’s housing affordability it is better to show the comparison between the two cities and to highlight how much more expensive Vancouver is.

It is my personal opinion that affordability does not accurately show livability as there are many different indicators that factor into how livable a city is and not just the cost of house. This includes the community of people that live in the area, the environment and weather conditions that all play a role in how people live their day to day lives.

Quantitative Data Classification

dataclass

There a number of ways to classify data into categories that make it easier for the reader, each with their own pros and cons in how the data is displayed. An example of this would be showing the affordability of Vancouver housing through a number of different classifications. As a journalist putting together maps of housing cost in Vancouver I would use the Natural Breaks classification method because it has the most census tracts categorized under the most expensive bracket. As a journalist I would want to display data that best supports my story and to show how prices are rising in Vancouver I would want an image that shows a large majority of areas that would be classified as expensive. But if I were a real estate agent I would use the Equal Interval classification to attract potential home buyers in the UBC area as the graph is almost entirely covered in the lowest cost bracket. I would use this graph to try and persuade the buyers that housing in Vancouver isn’t very expensive. Choosing which classification method to use can have ethical implications as depending on the type used, people can be giving out very misleading information to persuade others.

The cartographer has a lot of decision making power when designing these maps. The choices that are made in the way the data is represented can greatly influence the way information is interpreted.