One cannot make sense of the massive amounts of data being generated without algorithms in today’s world. For example, I attempted to read Code-Dependent: Pros and Cons of the Algorithm (Raine & Lee, 2017) like a “Spider Program” by opening and reading each hyperlink on the page. Three hundred sixty-eight words of the document led to examining the 21,000 words produced from the hyperlinks. In the same manner, the task of manually combing, ordering, combining, extending, transforming, and cleansing each row and column of the tabular data files from the curation of the Voyageur’s Golden Record would be daunting for an individual. Instead, mathematical algorithms retrieve, rank, analyze, and visualize metadata in a fraction of the time it would take a human.
Algorithms rule the modern world, silent workhorses aligning datasets and systematizing the world. They’re everywhere, in everything, and you wouldn’t know unless you looked.
Navneet Alang
The language of numbers is replacing the language of words in our encoded lifeworlds. Haas (1996) argued that “technology is always inextricably tied both to a particular moment in human history and to the practical action of the human life in which it is embedded” (xii). The world has moved towards greater interconnectivity via the internet. Images, music, and words that we send and receive travel through the internet network as pulses of light waves (The internet: How search works, 2017). The waves pulse following the coded binary numbers of (0,1). Therefore, one should not be surprised that the language of numbers has regained prominence as in Mesopotamia to communicate concrete, discrete information (Schmandt-Besserat, 2009).
As Boroditsky (2017) argued, language shapes thinking and how the user attends to and establishes relationships with the world; then a paradigm shift to mathematical thought: abstraction, logic, precision, and unambiguousness should be expected.
We have already turned our world over to machine learning and algorithms. The question now is, how to better understand and manage what we have done?
Barry Chudakow
The following two sections explore a few arguments about algorithms’ detriments or benefits to humanity.
Algorithms, the new phrenology
Many of those experts surveyed by the Pew Research Center, 2017 felt that the central issue of algorithms is the lack of transparency. Another issue is that not every algorithm is tested, debugged, or validated before implementation. As well, they are not neutral nor automatically munificent. Moreover, self-learning and self-programming algorithms’ operations are not transparent; thus, not easy to verify outcomes. “In the future, many algorithms will be trained, not designed; that means that the operations of many algorithms will be opaque and difficult to predict in border cases, and responsibility for their harms will be diffuse and difficult to assign” (Tuff, 2016).

When I consider the sloppy and self-serving way the companies use data, I’m reminded of phrenology, a pseudoscience that was briefly popular in the 19th century. Phrenologist would run their fingers over the patient’s skill, probing for bumps and indentations. Each one, they thought, was linked to personality traits … the skull probe would usually find bumps and dips that correlated with that observation – which, in turn, bolstered faith in the science of phrenology.
Phrenology was a model that relied on pseudoscientific nonsense to make authoritative pronouncements, and for decades it went untested. Big data can fall into the same trap. Models … continue to lock people out, even when the”science” inside them is little more than a bundle of untested assumptions”
Cathy O’Neil, 2016
Algorithms enhance exploration of metadata
On the other hand, other experts acknowledge the challenges of algorithms yet still believe that humanity can benefit from them, as shown by the Stanford Humanities department. Their creation of Palladio as a digital tool was used to map scholarly intellectual networks in 1500-the 1800s. They found that the analytical tool’s visualization revealed hidden patterns and repetitions that had been difficult to discern in the compiled metadata. “Palladio provides an opportunity to create a natural graph in which you have the possibility to use two different kinds of nodes” (Humanities + digital tools: Palladio, 2015). That project has since been turned into a lab accessible to other inquiries like ETEC 540 64C’s Task 9.
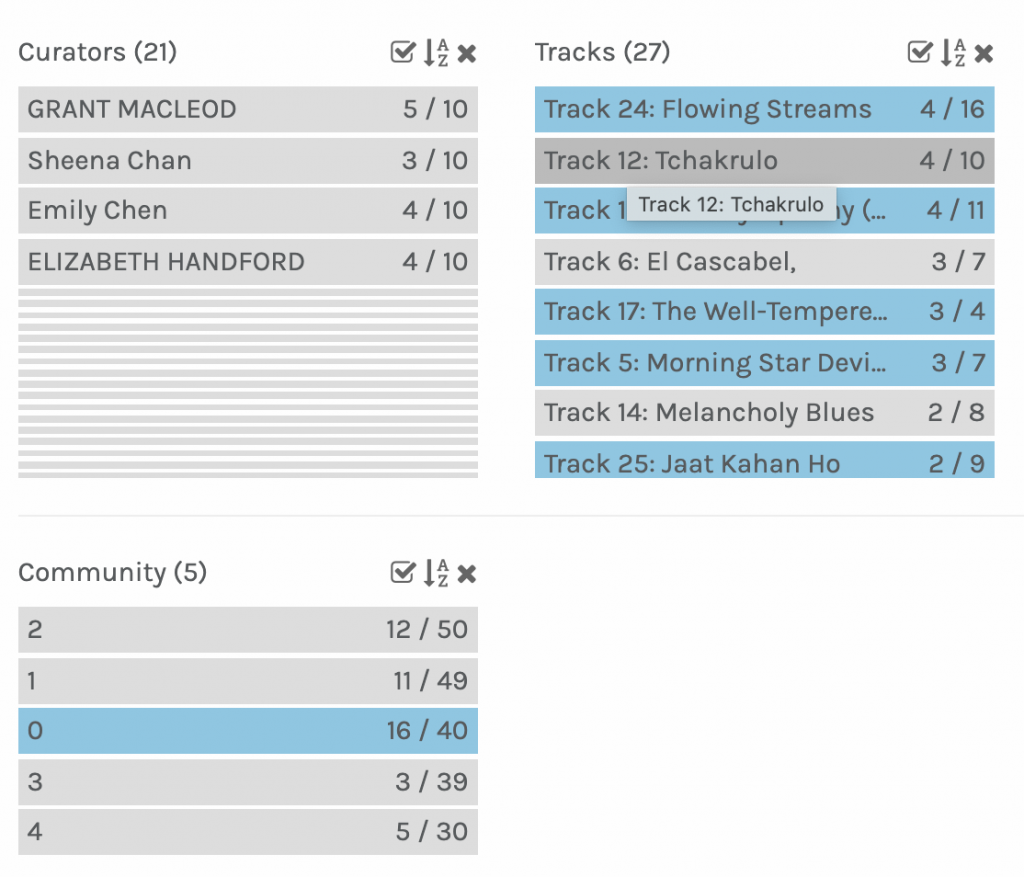
All the following visualizations, diagrams, tables have been created through this digital tool. Table 1 indicates which curators have chosen the tracks and clustered the curators into a community. However, it does not indicate which members belong in each community.
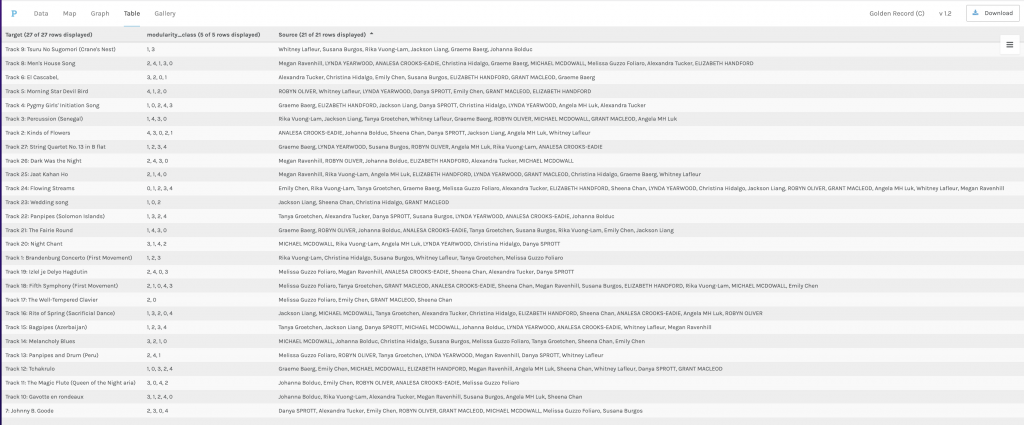
Spaghetti Data
The table above has been converted to an undirectional graph. It contains two different nodes: curators and musical tracks. The edges pair a curator with all their chosen musical track. At first glance, it would appear that there is a high degree of connectivity between the different curators.
Graph: Curators, Tracks, Edges
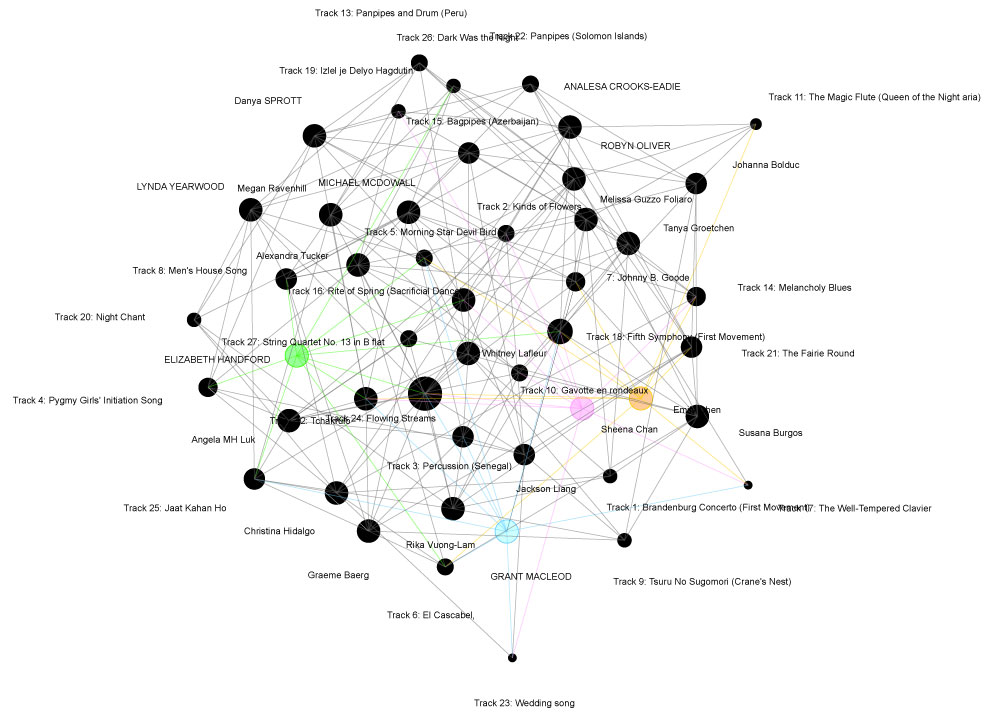
Lancichinetti et al. (2011) called the Simple Data Models, spaghetti data. While it looks like the edges intersect, in reality, they lay on top of each other like spaghetti on a plate. The overlaps and adjacency are not stored; therefore, there is redundancy in the data as it is stored several times. This causes limitations. As there is no easy way to check for overlap and slivers it is prone to errors which in turn causes analytical errors.
Community structure is one of the main structural features of networks, revealing both their internal organization and the similarities of their elementary units.
Lancichinetti et al., 2011
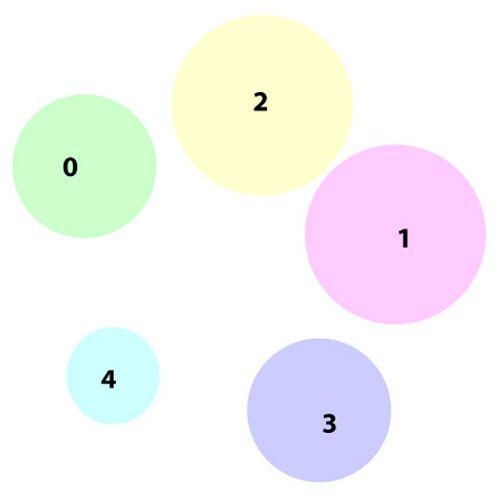
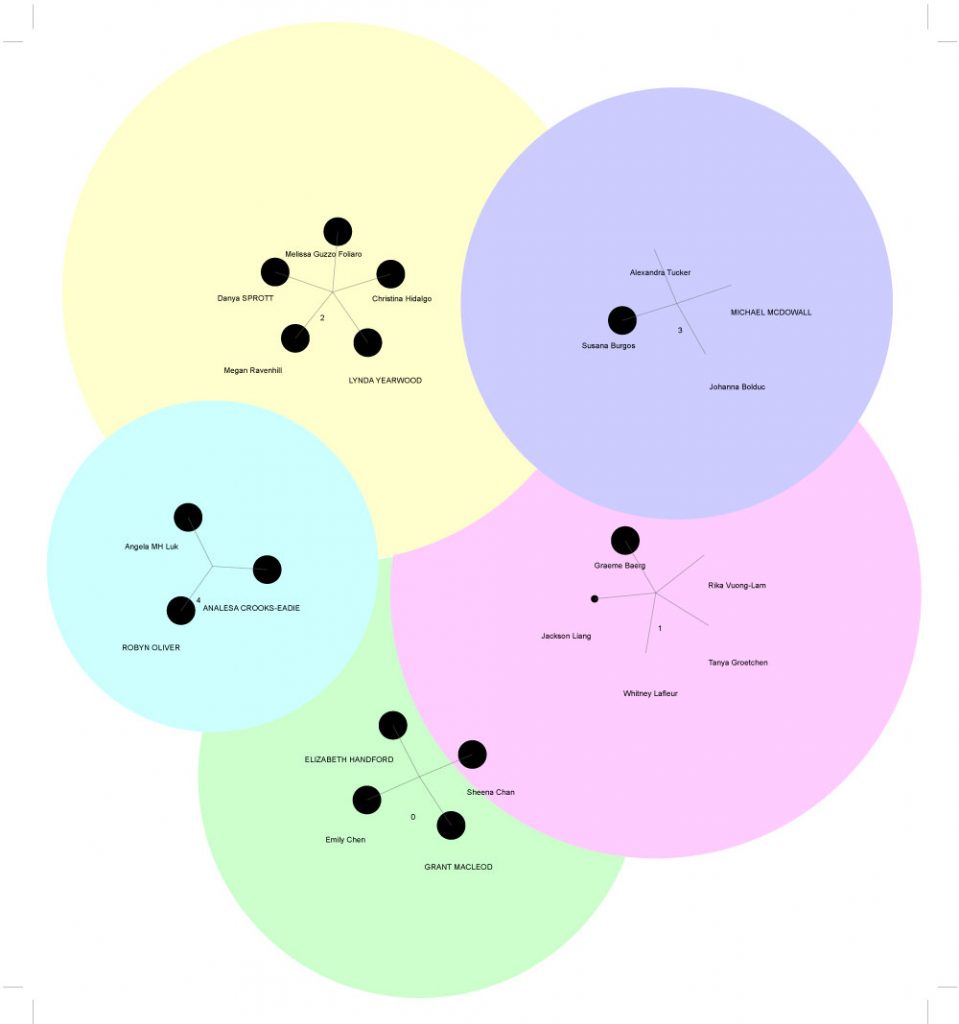
Metadata merged into five clusters
Palladio merged the metadata into five clusters that represent the community networks. The concise, compact visualizations reduce the need to deal with a maze of abundant edges and nodes resulting from the curated tracks.
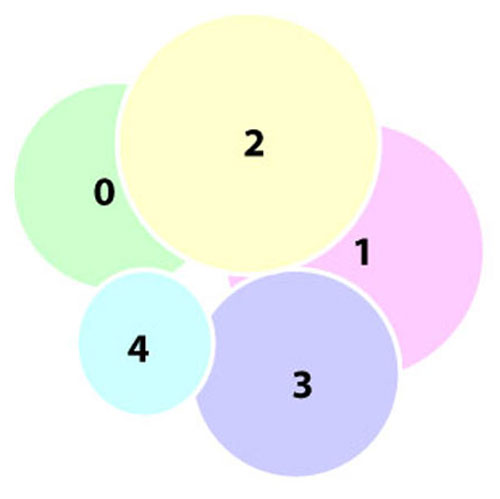
community, the sum of community, size nodes,
number of edges
society, the sum of community, size nodes,
number of edges
Graph 2 overlaping indicates logical relations between the communities; yet upon scrolling out, Graph 3 and 4 illustrates that intersections are not stored and the clusters are isolated. Graph 5 indicates community membership.
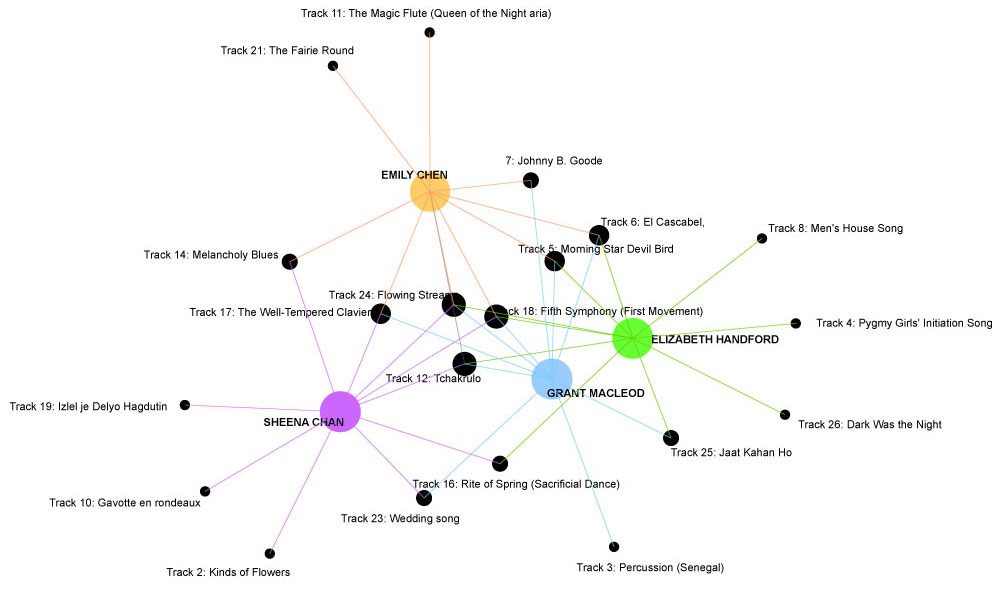
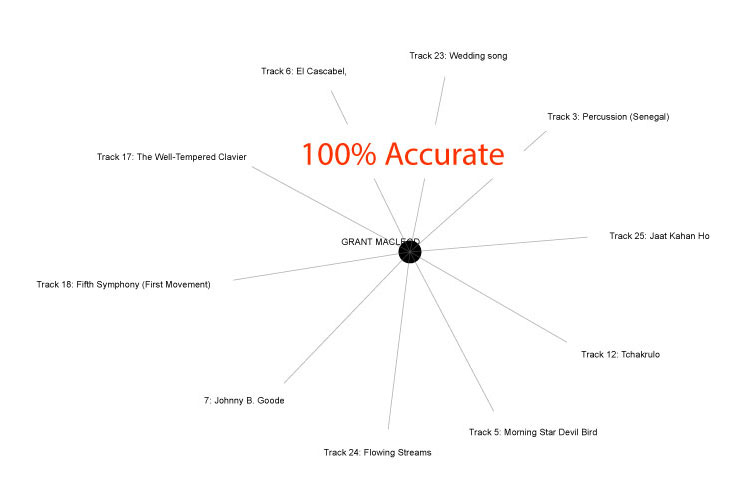
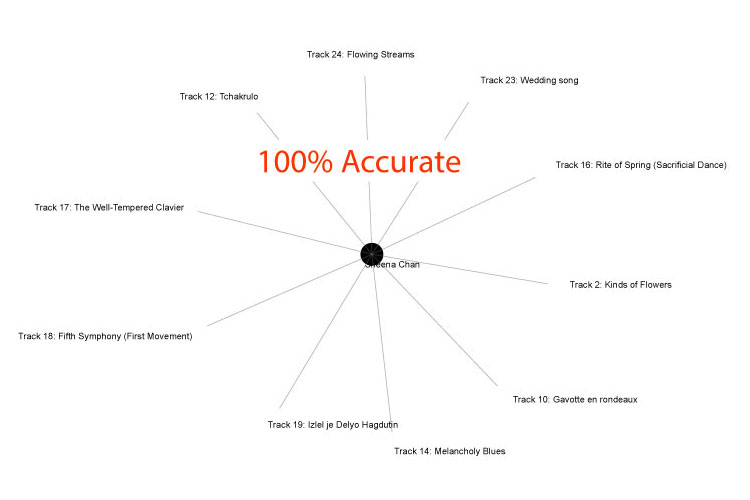
The curators and their edges have been colour-coded to facilitate seeing the links. The selections that multi-curators have chosen create a path between the nodes which indicates a set of nodes. These sets of nodes within this community are listed below. Grant has the highest degree of connectivity.
- Track 5 = {Emily, Grant, Elizabeth}
- Track 6 = { Emily, Elizabeth, Grant}
- Track 7 = { Emily, Grant}
- Track 12 = {Sheena, Grant}
- Track 14 = {Emily, Sheena}
- Track 16 = {Sheena, Grant}
- Track 18 = {Sheena, Emily, Grant,Elizabeth}
- Track 23 = {Sheena, Grant}
- Track 24 = { Emily, Sheen, Grant, Elizabeth}
- Track 25 = {Grant, Elizabeth}
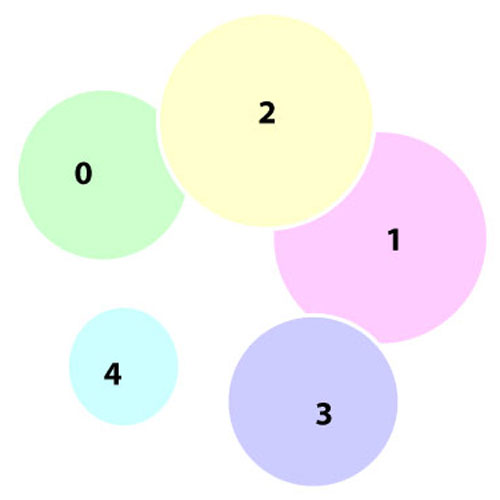
The information below also from Palladio about Community 0, (members Emily, Sheena, Grant, Elizabeth) does not match the sets of nodes indicated by Graph 6.
Track Choice: Blog Posting vs Palladio graph
As there were discrepancies between my blog post choices and what was being indicated by Palladio’s graph, I checked the other members of the groups. It seems that membership is linked to the number of sets that connect members. Thus, inaccuracies in the data sets would create erroneous results.
Connectivity is superficial. The edges pinball from one node to another, only distinguishing between curator and tracks. It is as if the digital tool was suffering from agnosia and could not fix on the whole data but just the parts.

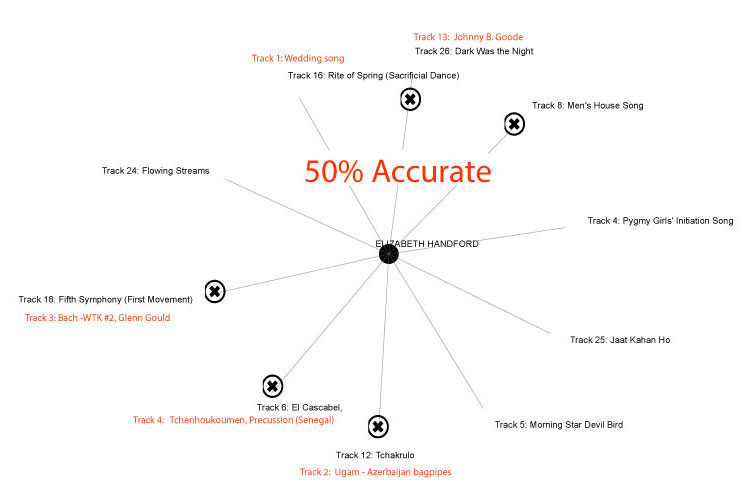
How strong is the relationship?
The lack of transparency does not enable an examination of the validity of the groupings. There is no way to tell exactly why the algorithm arrived at the networks it did. It is possible to guess that it simply summated all the links to each node as the graph was undirected. It could also have factored in which nodes were adjacent to or neighbouring each other.
Algorithms will always encounter missing and erroneous data, which disrupts their efficiency and accuracy, but this also holds for humans. Are the data-driven insights better, worse, or as good as human experience and knowledge in making predictions? We do not need to follow Phaedrus’ path: algorithms will cause problems and enhance our lives. Nevertheless, like writing, algorithms are not going away; they are already part of our everyday life.
References
Alang, N. (2016, May 13). Life in the age of algorithms. The New Republic. https://newrepublic.com/article/133472/life-age-algorithms
Boroditsky, L. (2011). How language shapes thought links to an external site. Scientific American, 304(2), 62-65.
Code.org. (2017, June 13). The internet: How search works. https://youtu.be/LVV_93mBfSU
Haas, C. (1996). Writing technology: Studies on the Materiality of Literacy (1st ed.). Routledge.
Mattingly, W. J. B. (2020, August 11). Palladio Tutorial DH Too for Network Mapping. https://youtu.be/OAVYEtBd_TY
O’Neil, C. (2016, September 1). How algorithms rule our working lives. The Guardian. https://www.theguardian.com/science/2016/sep/01/how-algorithms-rule-our-working-lives
Rainie, Lee and Janna Anderson, “Code-Dependent: Pros and Cons of the Algorithm Age. Pew Research Center, February 2017. Available at: http://www.pewinternet.org/2017/02/08/code-dependent-pros-and-cons-of-the-algorithm-age
Reducible. (2020, June 14). Introduction to graph theory: A computer science perspective. https://youtu.be/LFKZLXVO-Dg
Schmandt-Besserat, D. (2009). “Origins and Forms of Writing.” In Bazerman, C. (Ed.). Handbook of research on writing: History, society, school, individual, text.Links to an external site. New York, NY: Routledge.
Stanford. (2015, April 23). Humanities + digital tools: Palladio. https://youtu.be/nUUVgWxeATs
System Innovation. (2015, April 19). Network connection. https://youtu.be/2iViaEAytxw
Systems Innovation. (2015, April 29). Network dynamics. https://youtu.be/Mp-ddvQ1mRE
Tutt, Andrew, An FDA for Algorithms (March 15, 2016). 69 Admin. L. Rev. 83 (2017), Available at SSRN: https://ssrn.com/abstract=2747994 or http://dx.doi.org/10.2139/ssrn.2747994