Categories
Environment

Sweden Pesticide Tax

Background

Pesticide use can pose significant environmental externalities (3). Among other impacts is their effect on surface and groundwater contamination. Being a non-point source of such pollution, pesticide regulation is thus a complex policy issue.

In the 1980s, pesticides were a hotly debated topic in the Nordic countries. Although I am unable to find the precise trigger for such debate (I would appreciate if my readers would share any information on this), I found that Sweden was the first of these countries to formally address the environmental and health risks posed by pesticide overuse (4).

Introduced in 1984, the main goal of the pesticide tax was to reduce the usage of chemicals in the environment (1). Moreover, the tax revenues would be used to finance research and development of more environmentally benign practices, making pesticide reductions sustainable.

Specifically, Goal 1: By 1990, reduce consumption by 50% of the average of 1981-1985 levels; Goal 2: achieve further 50% reduction in consumption by 1996. In total, Sweden aimed for pesticide use reduction of 75% from before implementation of tax.

Implementation

The regulation was a Tax plus a Regulation Fee.

For the most part, the tax was administered as a fixed amount on every kilogram of active ingredient in the pesticide (1). Later, this was changed to a percentage of product price. The tax level changed many times since its introduction as summarized below (2).

  • 1984: SEK 4/kg active substance
  • 1988: SEK SEK 8/kg active substance
  • 1994: SEK 20/kg active substance
  • 1996: tax share is 8% of product price
  • 1999: tax share is 5% of product price

Moreover, a regulation price was also initially charged to finance the administrative cost of implementing this regulation.

  • 1991: SEK 46/ha dosage or 20% of the price of the pesticides
  • 1993: converted into a tax
  • 1995: abolished
  • 1996: pesticide regulation fee

Sectors Covered and Exempted

The tax is applied at the retail level. It is imposed on manufacturers and importers of pesticides. Exempt from the tax are wood preservatives (1).

Appropriateness and Effectiveness

At first glance, it seems that consumption indeed decreased nearly 50% by 1991, as desired. Although the stated goal of 75% reduction was not achieved, the total consumption as of 1996 does seem to be 35% of average 1981-1985 level.


Pesticide Sales in Sweden 1981-2002

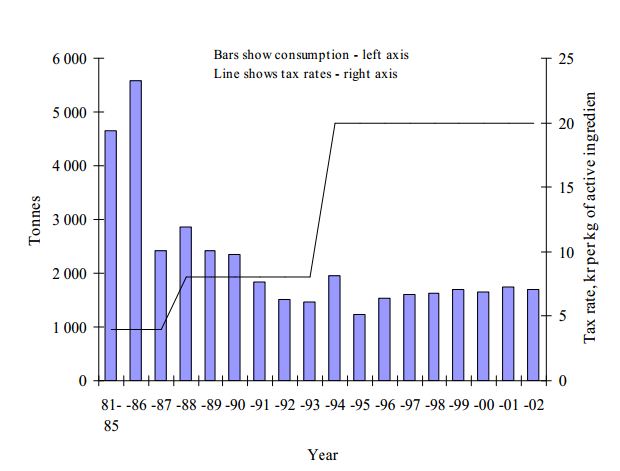
Figure taken from (1).

However, as we can see from the graph above, even when the tax rate more than doubled from 8 SEK to 20 SEK in 1994, there was no overall decrease in the volume of pesticides used. Instead, the Swedish Board of Agriculture and National Inspection found that farmers increased their purchases of low-dose pesticides (those that are biologically active at very low concentrations per hectare) (5). This was likely a result of the “soft effects” of the tax (4). That is, tax revenues were used to finance research that resulted in pesticides that were biologically active at low doses. Therefore, instead of looking at number of tonnes sold, if one were to examine the number of doses sold, there would be a definite increase since 1995 (4).

An obvious question that arises is whether a reduction in gross volume of pesticide use is equivalent to a reduction in risk to the environment or to health. A flat tax like the one implemented in Sweden treats all active ingredients the same, regardless of the level of environmental and health damage that they impose. It therefore merely encourages a shift from high to low volume products, which may in fact be more hazardous.

The more recent shift towards a tax as a percentage of pesticide prices may not be the particularly effective either, as prices may promptly decline as a result of technological change (that the tax revenue is funding!) (3), ultimately encouraging more pesticide use.

Therefore, rather than aiming for a reduction in tonnage of pesticide (active ingredient) used, a tax implemented on a hazard or estimated damage basis would be a more effective solution in my opinion. Even though I can see difficulties in estimating its value, such a tax would more explicitly address the social cost of the pesticide, rather than simply the quantity.

Moreover, the research and development which is being funded by the tax revenues would better achieve the stated goals if it was aimed at discovering pesticides which have lower damaging effects.

References 

  1. http://epubl.ltu.se/1404-5508/2005/101/LTU-SHU-EX-05101-SE.pdf
  2. http://www.economicinstruments.com/index.php/land/article/135-
  3. http://siteresources.worldbank.org/INTWRD/903845-1112344347411/20424145/31203ARDenoteWRMEIPearceKoundouri.pdf
  4. http://www.pan-europe.info/Archive/publications/PesticideTax.htm
  5. http://ec.europa.eu/environment/enveco/taxation/pdf/ch8_pesticides.pdf
Categories
Environment

British Columbia’s Carbon Policy: a curious case of leadership loneliness

Political Origin

In May of 2009, against daunting odds and a historically low voter turnout, the incumbent Premier of BC – Gordon Campbell – led the Liberal Party into a third term. In an article on the politics of that election in Macleans (1), Andrew Coyne argues that although it was widely unpopular at first, the NDP’s strident opposition to the tax during the election campaign may have overwhelmed their own commitment to environmental sustainability (2). In this setting, carbon tax being a bold, risky conviction may have actually led to the Liberal victory.

On July 1, 2008 when it was implemented, BC became the first North American jurisdiction to have committed to such a carbon tax regime. Originally slated at $10/tonne greenhouse gas emissions (GHGs), the tax was designed to rise incrementally each year, until it hit $30/tonne in July 2012. Phasing it in was intended not only to allow British Columbians to adapt to a low carbon footprint, but also for other jurisdictions to follow their lead (3). The situation today is that the tax has reached $30/tonne as expected, 57% of British Columbians support it, but BC is still the only jurisdiction in North America to have it in place. A discussion of the distributional and economic effects of this policy follows in this article.

How it works 

Traditionally, there are two instruments of reducing emissions. The first is a quantity-based Cap and Trade system, whereby a total abatement level is fixed (or emissions are capped) at a certain level by the government, and emissions permits are auctioned (or given away) among the highest emitters in the market, who can then buy or sell them based on their individual needs. The guarantee of emissions reduction, and the economic efficiency generated from the trade of emissions credits are some of the positives of such a scheme. Additionally, government revenue can be increased by a competitive auctioning process, which can then be put towards minimizing the adverse distributional impacts of the policy. However, it is argued that by penalizing industrial polluters, not only will local industries become disadvantaged, but also there may be little incentive for individuals or households to switch to energy-efficient solutions.

The second mechanism is a carbon tax, which puts a price on each tonne of GHG emissions, raising the price of the fuel to reflect the true social cost of emissions (i.e. accounting for the externality of pollution). This is done to elicit a market response in order to reduce emissions. The advantage of this system over cap and trade is that it covers all polluters and fuels equally. However, it is argued that such a policy disproportionately hurts the poor whose demand for fossil fuels is inelastic, and who do have not enough income to adapt to newer technologies.

In this context, British Columbia has adopted a “revenue-neutral carbon tax” which is championed as reaping “double dividends”: emissions reductions as well as the removal of distortions. The policy stands on the following five pillars (4):

  • All carbon tax revenue is recycled through tax reductions (that is, all carbon tax revenue will be returned to tax payers through tax reductions, rather than being used to fund government programs)
  • The tax rate started low and increases gradually (to allow time for adaptation)
  • Low-income individuals and families are protected (through tax credits)
  • The tax has the broadest possible base (covering nearly all fuel combustion as captured in Environment Canada’s National Inventory Report)
  • The tax will be integrated with other measures (such as cap and trade)


Tax rate for individual fuels is determined by the amount of GHG released from burning it. Moreover, practically, this scheme is relatively simple to administer, as the tax is collected in much the same way as motor fuel tax (with the exception of natural gas, which is collected at the retail level).

My two cents: Cost-effectiveness and Distributional Effects

The effectiveness of the tax at reducing emissions has been observed since its implementation in 2008, whereby the average emissions for BC are lower than that of Canada as of 2013. It is projected that in the absence of all other GHG reduction strategies, the carbon tax alone could cause a reduction in British Columbia’s emissions in 2020 by up to three million tonnes CO2 equivalent annually (5).

However, the sustainability of this scheme can be questioned, because of its potential to slow economic growth. For instance, as the government itself reports, the tax returns that the revenue-neutral scheme promised have actually been $192 million in excess of what was collected by the policy in 2011/2012 (6). It is therefore no surprise that there is wide buy-in for the policy. However, this only means that lower government revenues are available for other government services, which is a cost that needs to be accounted.

Moreover, as long as other jurisdictions in Canada and the U.S. do not subscribe to some form of emissions reductions scheme, British Columbia’s relatively higher-cost industries (thanks to the tax) will continue to face an unfair disadvantage in the national or world market (particularly against industries in Alberta) (7). This may lead to individuals and businesses migrating to other provinces to resume their operations and stay competitive.

Therefore, must leadership in carbon policy be by example? Perhaps it would be more effective to push for a regional or national reductions plan than treading solo. Although the government has accounted for distributional inefficiencies by making the tax revenue-neutral, long term data on economic growth will reveal whether this is a truly effective and sustainable reductions regime.

References
1. http://www2.macleans.ca/2009/05/26/a-new-coalition-a-different-politics/
2. http://www.carbontax.org/progress/where-carbon-is-taxed/
3. http://www.bcchamber.org/advocacy/policy/provincial_gov/finance/bcs_costly_carbon_tax.html
4. http://www.fin.gov.bc.ca/tbs/tp/climate/A1.htm
5. http://www.fin.gov.bc.ca/tbs/tp/climate/A4.htm
6. http://www.fin.gov.bc.ca/tbs/tp/climate/A2.htm
7. http://taxpayer.com/blog/03-10-2012/bc-carbon-tax-unfairness-continues-hamper-economy

Categories
Environment

Add to the Marginal External Costs of Fracking: Livestock Health

Hydraulic fracturing – “fracking” – of shale rock formations is taking place across the landscape of the ‘true north’. While supporters see in it a promising future for meeting the world’s energy needs, critics see an environmental disaster. Economists, as usual, see unaccounted negative externalities (1).The fracking technique imposes both global and local negative externalities, such as greenhouse gas emissions and groundwater contamination, respectively. An exhaustive list can be found on Ed Dolan’s blog (1); although admittedly, not all of those have been quantified.

Recently, the first and only peer-reviewed study on the link between fracking and livestock health was published in New Solutions: A Journal of Environmental and Occupational Health Policy. Although the death toll of livestock in shale-gas states was not very high, they were reported to have experienced neurological, reproductive and acute gastrointestinal problems (2). The costs to dairy farmers from the death of their capital, and to consumers from potential health risks has now been quantified and can, and must be added atop the other costs already traced to the engineering marvel.
References:

1.http://www.economonitor.com/dolanecon/2012/05/04/fracking-and-the-environment-an-economic-perspective/
2.http://www.theecologist.org/News/news_analysis/1784382/livestock_falling_ill_in_fracking_regions_raising_concerns_about_food.html

Categories
Environment

Northern Gateway Pipeline

http://www.cbc.ca/asithappens/episode/2012/09/04/the‐tuesday‐edition‐45/

Why the creation of the Gateway pipeline from Alberta to Kitimat BC will raise the price of crude oil for Canadian refineries:

The Northern Gateway pipeline that will transport crude oil from Alberta to Kitimat, BC is expected to double the size of the potential market for Canadian crudes (1), as it will allow the export of this oil to ports across the Asia-Pacific. The concern however, is that this will raise the price of crude for Canadian refineries.

The answer to why this will happen lies in the economics of international trade. There are essentially three players in this scenario: the Canadian crude producers, Canadian refineries (domestic consumers), and Asian or other foreign refineries (foreign consumers). As a producer of crude oil, Canada’s market clearing price of oil is lower than the world price. Once the pipeline is built, Canadian producers will be able to access foreign markets where refineries are willing to offer this higher world price for Canadian crude oil. Foreign refineries will therefore become more “attractive clients” (1) than domestic refineries for Canadian producers which will incentivize export of crude oil. Exports of oil will mean that less is available for domestic consumption. This will raise the former market clearing domestic price of crude to the world price and as a result, Canadian refineries will have to face this higher price.

1. http://www.ceaa.gc.ca/050/documents_staticpost/cearref_21799/4234/Attachment_01.pdf

Spam prevention powered by Akismet