My responses to the Golden Record Curation Quiz in Task 8 were similar enough to those of Jessica, Jocelyn, Katie, Kayli, and Sage, that the six of us were placed in a community.
On our websites, each of us provided an explanation of how we selected 10 of the 27 original Golden Record tracks, detailed below.
- Jacey (me): representation of human diversity including geography, gender, race, social status, and language of musicians
- Jessica: representation of different cultures and musical styles, sound quality was a factor
- Jocelyn: representation of different cultures, inclusion of both instrumental and vocal tracks
- Katie: representation of each inhabited continent, priority given to human voice, tracks with the most global influence
- Kayli: representation of all humanity, each continent, and songs old and new
- Sage: pertinence to the human experience, wealth of information, and decipherability of tracks
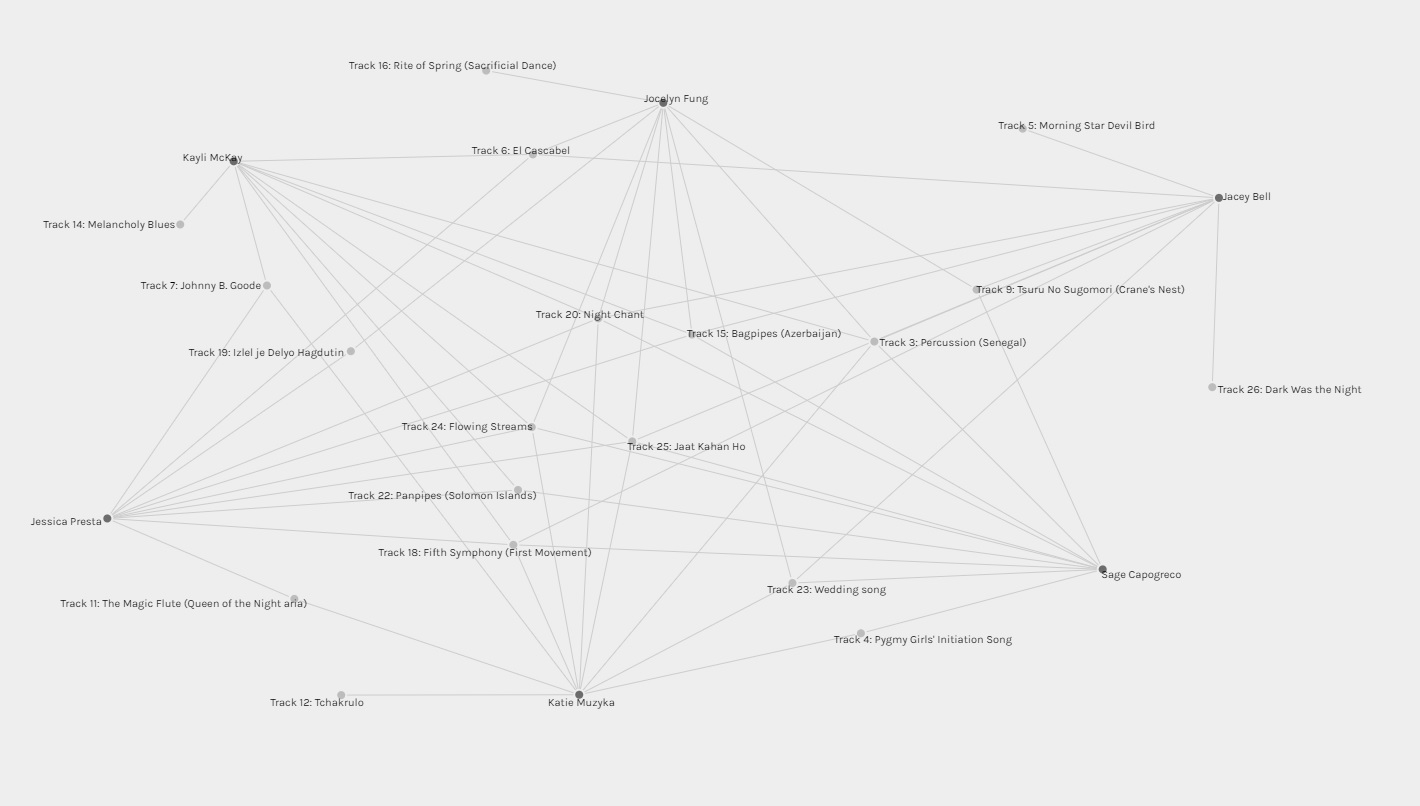
Once I loaded the class data into the palladio app, I spent quite a bit of time playing around the visualization. Perhaps because of my training as a scientist, I really enjoy creating images that summarize data points. One of the first things I did was move around the names of the community members to minimize overlap of text and better see the connections, pictured below:
 I then removed the names and connections and selected the option to weight the points. The following image shows the 19 tracks that were selected by at least one of us in the community. The different sizes of the circles associated with each track corresponds to the number of times the track was chosen. The largest circles represent tracks that were selected by all six of us and the smallest circles indicate tracks that were a unique choice.
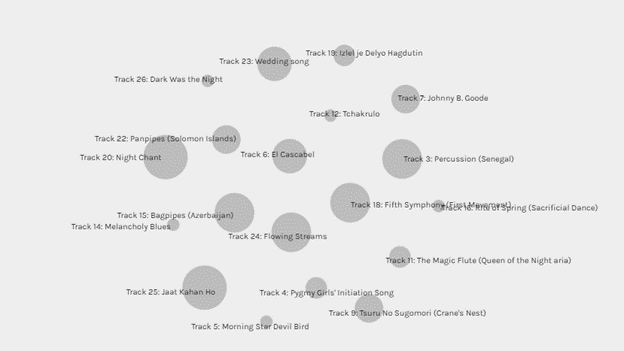
And finally, because I couldn’t help myself, I made a little spreadsheet that summarizes which songs were chosen by whom. I noticed that in our rationales for our choices, we all mentioned trying to represent different countries, cultures, and human experiences, so I added a column that indicates on which continent the track was created.
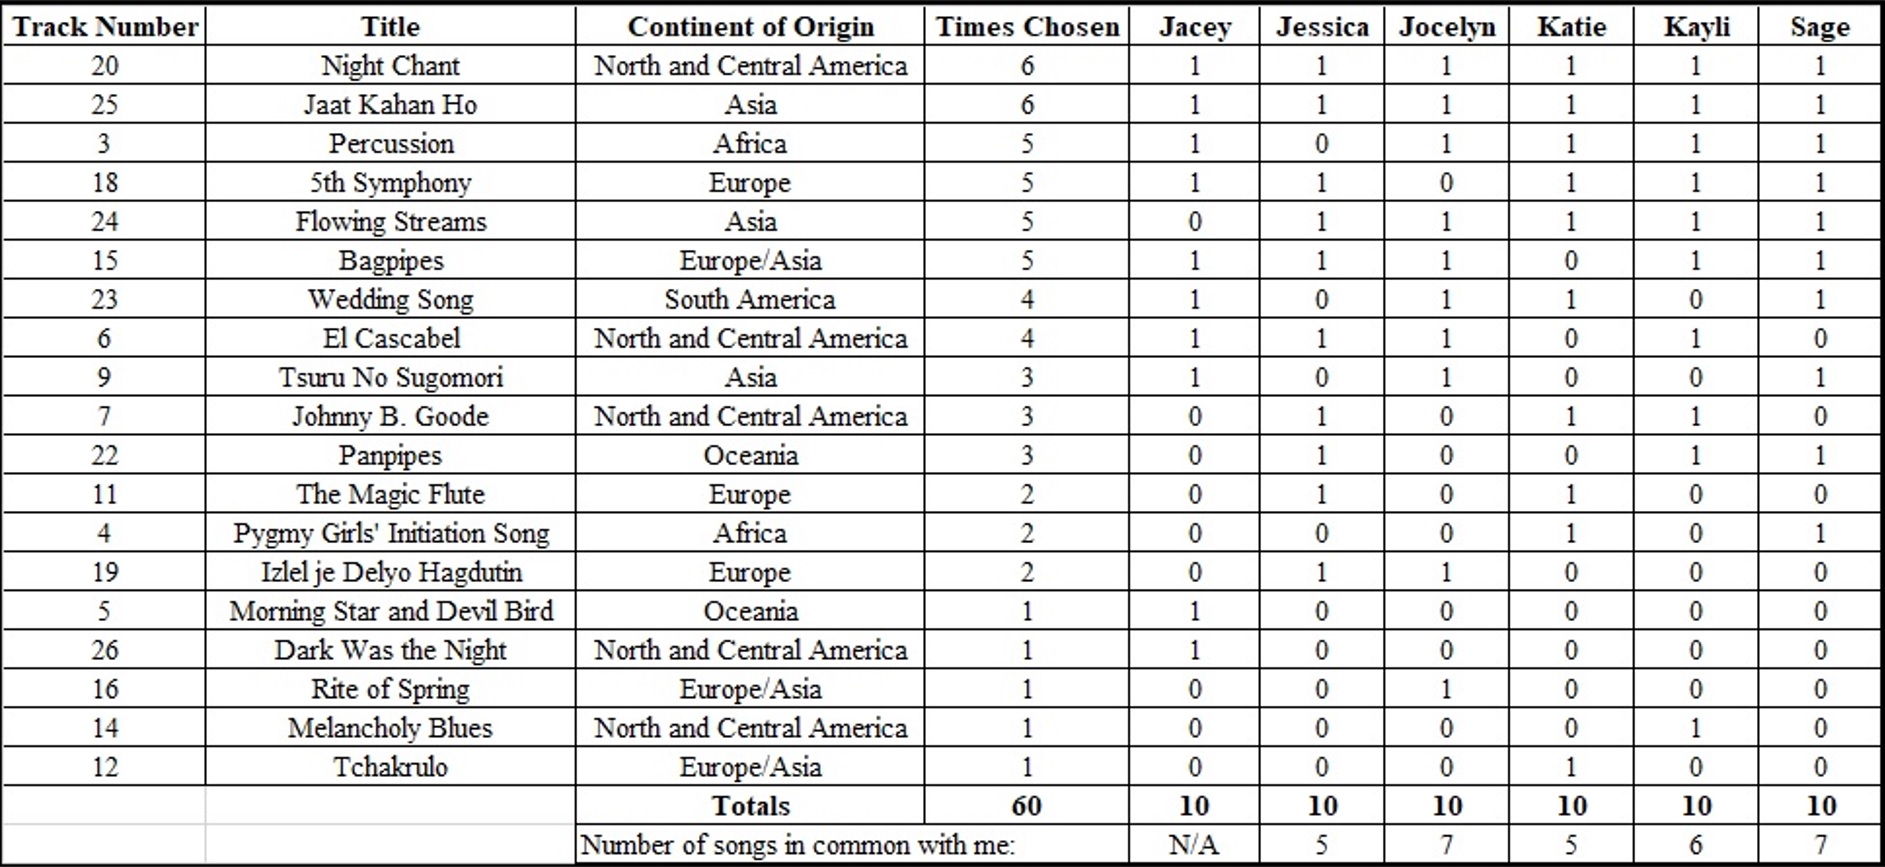
It appears that we did quite a good job of representing all of the continents on Earth, with the exception of Oceania in a couple of cases. This, however, is understandable. There were not many tracks on the original Golden Record that originated in Oceania. The track listings did not show the location of origin in the visualization, but a viewer could likely assume our motive of cultural diversity just by seeing the titles of the tracks in various languages. Without listening to each track, however, a person analyzing the data would not be able to infer motives such as effort made to include both vocal and instrumental music, both male and female vocalists, both songs old and new, or the emphasis on sound quality and/or decipherability of the tracks. Even after listening to all of the chosen tracks, the analyst would still be just speculation about our motives. As for the tracks we didn’t choose, I don’t think that the data visualization could ever show why a specific track was not included. Personally, I focused so much on picking the tracks that fit into my set of requirements, that I didn’t spend much time thinking about why I excluded certain tracks. Upon reflection, I had a difficult time deciding to exclude some of the tracks and what it really came down to was personal preference. If two tracks checked all the same boxes of my requirements, I would select the one that I thought “sounded better”. I’m sure there are some subconscious reasons based on my own human experience that led to the decision, but if I can’t even put it into words, I doubt that data could ever show the reason.
One Important Takeaway From This Exercise
Within our community of six people, a total of sixty choices were made regarding which tracks should be included. The number of choices made was more than double the number of tracks that were available to choose from, so I would have expected to see all 27 of them in our spreadsheet. However, a total of only 19 songs were chosen, 11 of them by at least half of us. This made me think about social media and how we mostly end up interacting with people in our online communities. These communities are often formed by people with similar interests or points of view, much like our community here was based on track choices. This exercise showed me how confirmation biases and misinformation spread so easily on social media. If the tracks were articles that we shared with one another, some of the articles would be shared over and over, while others would not be mentioned at all. Imagine that the articles (tracks) not being shared held opposing viewpoints to the ones we chose multiple times. The people within our community could internalize the information in those articles without ever being exposed to an opposing idea. This analogy really helped me understand the importance of consuming news from multiple sources outside of social media.
Regarding Task 9: Hi Jacey, I think you did a fantastic job segregating each type of song to its origin! I also did the same thing! It’s weird b/c I ended up purposely clicking on every item b/c I had decided to use the space on the Golden Record differently. Instead of just choosing 10 items, I rearranged the choices by using regions, (just as you did) and I decided to cut the times of each song from each region rather than cut out any song – so that all 27 items would fit equally but organized it in a way so that every continent/region was equally represented. I think this task was eye-opening in that it shows me that although we have all the data, each of us interpreted the data differently b/c we are still missing vital information on who specifically chose what items AND why…it’s the why that is not represented at all in this curation data quiz. Makes me wonder how so many other data quizzes and algorithms are being misinterpreted in similar ways. You said it perfectly, “this exercise showed me how confirmation biases and misinformation spread so easily on social media.” Thanks for a great share Jacey! -Selene 🙂