Link to Task 3: Voice to Text with Agnes

I was immediately drawn to Agnes’ voice to text story because it is all about moving from Ontario to Saskatchewan. I have lived in Saskatchewan my whole life and was excited to read about the perspective of someone who hasn’t always been here. I was so happy to hear about her experiences with the sunrises, sunsets, and distant horizon in the Land of Living Skies. I really think the skies are one of the highlights of the province, and sometimes I take it for granted. A few years ago, I participated in a science outreach program in a small town southeast of Saskatoon. One of the other volunteers was a new international M.Sc. candidate at our university and had just come to Saskatchewan the week before. Despite the minus 30 C weather, he asked more than once to pull over on the highway during our long drive to photograph the sky. It was then that I remembered just how lucky I am to see it all the time!

Agnes used the voice to text tool embedded in Google Docs, whereas I chose to use Speechnotes. It seems that we had similar experiences with the output generated by the technology as we both noted a lack of punctuation and inappropriate capitalization of words. In my story, the word “Garden” was capitalized multiple times and in Agnes’ story the words “Farmland” and “Community” were capitalized as well. I wonder if the technologies picked up on a certain cadence in our voices or some other subtle nuance in our speech patterns to decide that those words sounded like proper nouns. I got the impression that we both spoke a bit unnaturally while dictating to the laptop, which might have had an effect.

Link to Agnes’ Voice to Text Story

Thanks for sharing your story, Agnes! I enjoyed reading it.

Task 12: Speculative Futures

For my speculative futures, I imagined that each student was assigned an artificial intelligence (AI) personal digital assistant (PDA) on the day they started school. To be honest, I found this task quite difficult. I have never been much of a creative writer, and often find myself getting worried about whether my stories are believable. So I challenged myself to take a leap outside of my comfort zone and write a little narrative about the worst-case scenario and the best-case scenario of introducing AI companions to children.

In the dystopian future, the PDA is fully integrated into the students’ everyday lives as a constant companion. The AI has access to their physiological information and learns to anticipate what each person wants or needs. The students learn to rely on the PDA and lose motivation to learn things themselves. They exist in a state of social isolation because they are unable to make friends that understand them on the same level that their AI assistant does. An adult is present in the school for supervision, but does not actively participate in lesson planning or teaching.

In the utopian future, the PDA is designed to act as a tool to facilitate learning. In classrooms that emphasize collaboration, creation, problem solving, synthesis and understanding, the AI acts as a teaching assistant. Although the PDAs can provide tailored lessons for students, the school board has noticed students respond much better to comfort or encouragement from a living entity, so continues to hire teachers as classroom facilitators. Using the physiological data and knowledge of the student’s thought patterns, AI can predict situations where the student would learn best through group activities and communicate with the other PDAs and teacher to form ideal learning groups. The PDAs are programmed not to simply answer questions that students have, but rather to give the students a series of prompts to help them recall prior knowledge and make their own connections.


Dystopian Scenario

It is the year 2052 and George sits alone in the high-speed shuttle that will take him to school. He doesn’t understand why he has to go to school, and says as much to his PDA and best friend, Ben.

George: Fifth grade is stupid. Why do I have to go?

Ben: Because it is required by law.

George: Well, still. What’s the point of studying? You can just look up the answer if I want to know anything.

Ben: Perhaps the adults wish for you to have social experiences.

George: But why? None of the other students understand me the way you do. I don’t want to be friends with them.

Ben: Understandable. I do have superior intelligence and insight into your emotional state. Do you want to hear a joke?

Ben has calculated that George is in a bad mood, but knows exactly what joke to tell to cheer him up. George smiles as he leaves the shuttle and shuffles into the classroom to sit at his desk. He brings up the morning assignment on his tablet without greeting any of his fellow students.

George: Okay Ben, let’s get this math assignment done. What is four squared?

Ben: 16.

George: Nice. How about six squared?

Ben: 36.

George: Two cubed?

Ben: 8.

They continue on like this until the assignment is complete. George gets 100%. Then George asks Ben to play him a video. Ben selects the video with the ideal amount of action to keep George engaged. They watch the video together and talk about how cool the fight scenes are until an alarm rings, alerting the students to open their tablets to the next assignment. George rolls his eyes as he scans the science assignment. He can’t wait until it is time to go home and play video games with Ben. 


Utopian Scenario

It is 2052 and Amelia is excited for her school day. She skips into the classroom and sits on one of the cushions in the middle of the room, next to her friend Dave. The teacher greets the class and tells them it’s time to start on math. Amelia starts up her tablet and the day’s assignment is displayed on the screen before her. Her PDA, who she has named Barb, indicates that she thinks Amelia will do best working on this assignment independently.

Amelia: What is four squared? Hmmm. Barb, can you help?

Barb: Of course. Do you remember what is special about a square?

Amelia: Um, all the sides are the same length?

Barb: That’s right. So if one side is four…

Amelia: All the other ones are too!

Barb: Exactly. Can you draw that?

Amelia sketches out a square on her tablet and marks 4 on each side.

Amelia: So, four squared is a square that has 4 on every side?

Barb: Yes, in a sense, but how will you write that as an equation?

Amelia looks again at her drawing, and adds a grid pattern to the square. She is lost in thought for a moment.

Amelia: If I make it a grid like this, there are 4 squares on the top, 4 on the side, and… 16 total! And 4 X 4 = 16! Does this mean four squared is 4 X 4?

Barb: You’re correct! Well done.

Amelia: I like math. It’s like a puzzle!

The teacher comes around and checks on the students periodically. Her instructor’s tablet has an app that the AIs can use to notify her if a student is particularly frustrated or having an emotional reaction to the work.

Amelia continues working on her assignment until the teacher announces outside time. The students all follow the teacher out into the schoolyard for some fresh air, chatting back and forth about what they did on the weekend.

Task 7: Mode Bending

While revisiting Task 1: What’s in my Bag?, I thought about the purpose of the assignment. My favourite thing about the task was getting to know a little bit more about my classmates, their interests, and their everyday lives by seeing the different items they carry on a regular basis. My goal with the redesign was to stay true to the original task and use a personal object to convey information about myself, but to use a different medium. I decided to change up the assignment by focusing on a single item in my bag and using it to inspire a short audiovisual story about something that is important to me, why it is important, and how it influences my actions. I made the video using the In Shot video editing app on my iPhone, then uploaded it to Tik Tok as a way to share it. I had intended to spend some time learning how to use Tik Tok this summer so I could incorporate it as a teaching tool in my lab this fall, and this task gave me the push I needed to figure it out.

Something I enjoyed about this redesign is how specific I could get. I was able to target a single item in my bag, then a specific feature of that item, and use that feature to tell a story. This could be done for any item in any person’s bag, and I think each of us could come up with dozens of different stories that somehow relate to the physical items we carry with us. I spent quite a long time deciding which item to use and which story I wanted to tell. Perhaps a fun future project would be to make a series of short videos; possibly one video for each item in the bag. One of the best parts of redesigning the task to an audiovisual medium was how easy it was to insert my personal humorous touches. I feel like using my voice instead of text to convey my story made it more personal.

Some of the challenges I encountered with the redesign included learning how to voice-over a video with multiple short clips and making sure that I had the right video clips to fit my narrative. It was very time-consuming and had specific hardware and software requirements (e.g. camera, microphone, editing software, internet access) that would need to be taken into consideration if I were to incorporate this type of activity into my classroom.

Overall, I thought that mode-bending was a very useful exercise. The products of both Task 1 and Task 7 fulfilled the same purpose, but the process of creating them used different skill sets.


@that.biology.teacher

What can the itwms in my bag tell you about my interests? This video is part of ETEC 540 Task 7.

♬ original sound – that.biology.teacher


Task 9: Network Assignment Using Golden Record Curation Quiz Data

My responses to the Golden Record Curation Quiz in Task 8 were similar enough to those of Jessica, Jocelyn, Katie, Kayli, and Sage, that the six of us were placed in a community.

On our websites, each of us provided an explanation of how we selected 10 of the 27 original Golden Record tracks, detailed below.

  • Jacey (me): representation of human diversity including geography, gender, race, social status, and language of musicians
  • Jessica: representation of different cultures and musical styles, sound quality was a factor
  • Jocelyn: representation of different cultures, inclusion of both instrumental and vocal tracks
  • Katie: representation of each inhabited continent, priority given to human voice, tracks with the most global influence
  • Kayli: representation of all humanity, each continent, and songs old and new
  • Sage: pertinence to the human experience, wealth of information, and decipherability of tracks

Once I loaded the class data into the palladio app, I spent quite a bit of time playing around the visualization. Perhaps because of my training as a scientist, I really enjoy creating images that summarize data points. One of the first things I did was move around the names of the community members to minimize overlap of text and better see the connections, pictured below:

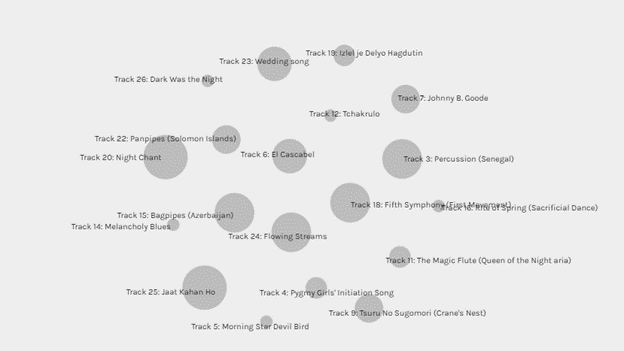
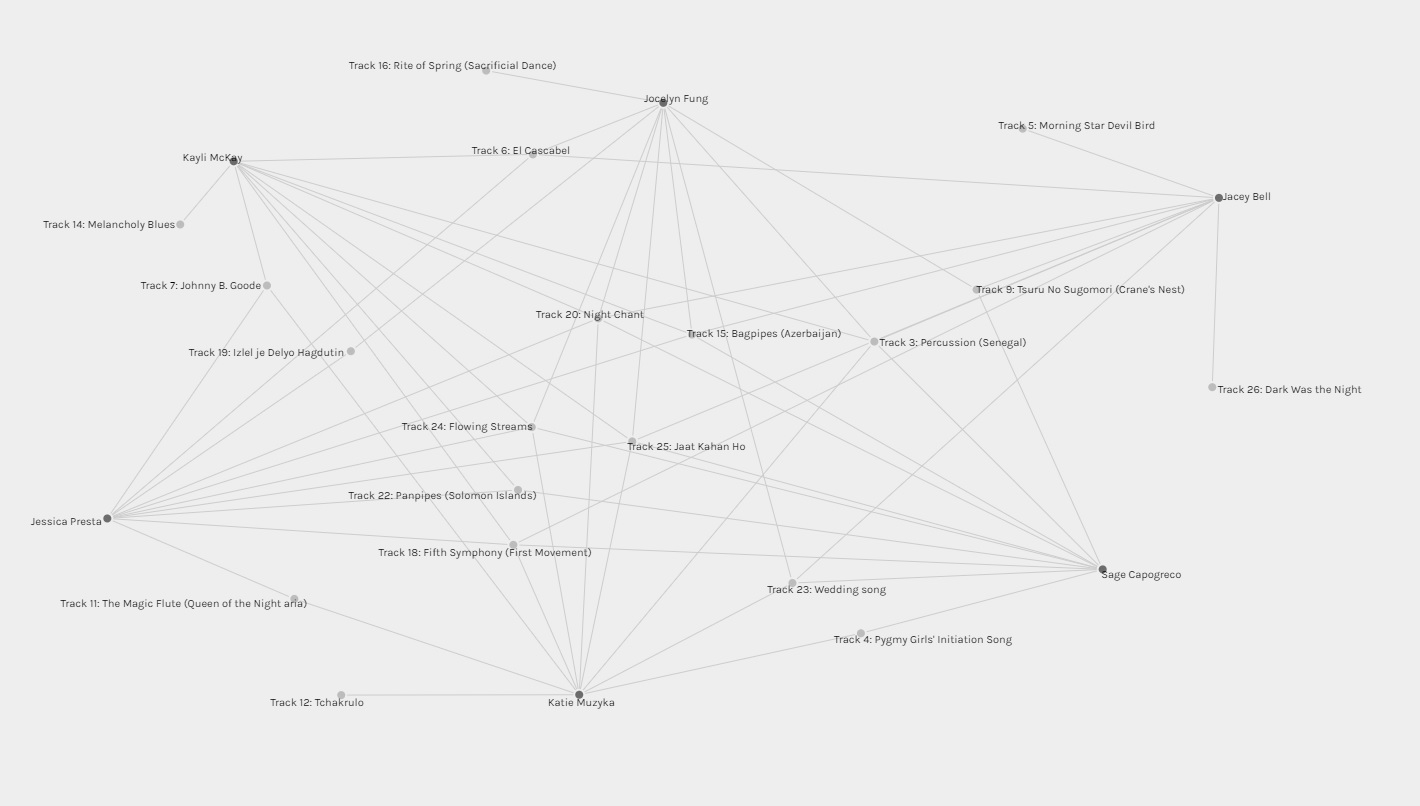
I then removed the names and connections and selected the option to weight the points. The following image shows the 19 tracks that were selected by at least one of us in the community. The different sizes of the circles associated with each track corresponds to the number of times the track was chosen. The largest circles represent tracks that were selected by all six of us and the smallest circles indicate tracks that were a unique choice.

And finally, because I couldn’t help myself, I made a little spreadsheet that summarizes which songs were chosen by whom. I noticed that in our rationales for our choices, we all mentioned trying to represent different countries, cultures, and human experiences, so I added a column that indicates on which continent the track was created.

It appears that we did quite a good job of representing all of the continents on Earth, with the exception of Oceania in a couple of cases. This, however, is understandable. There were not many tracks on the original Golden Record that originated in Oceania. The track listings did not show the location of origin in the visualization, but a viewer could likely assume our motive of cultural diversity just by seeing the titles of the tracks in various languages. Without listening to each track, however, a person analyzing the data would not be able to infer motives such as effort made to include both vocal and instrumental music, both male and female vocalists, both songs old and new, or the emphasis on sound quality and/or decipherability of the tracks. Even after listening to all of the chosen tracks, the analyst would still be just speculation about our motives. As for the tracks we didn’t choose, I don’t think that the data visualization could ever show why a specific track was not included. Personally, I focused so much on picking the tracks that fit into my set of requirements, that I didn’t spend much time thinking about why I excluded certain tracks. Upon reflection, I had a difficult time deciding to exclude some of the tracks and what it really came down to was personal preference. If two tracks checked all the same boxes of my requirements, I would select the one that I thought “sounded better”. I’m sure there are some subconscious reasons based on my own human experience that led to the decision, but if I can’t even put it into words, I doubt that data could ever show the reason.

One Important Takeaway From This Exercise

Within our community of six people, a total of sixty choices were made regarding which tracks should be included. The number of choices made was more than double the number of tracks that were available to choose from, so I would  have expected to see all 27 of them in our spreadsheet. However, a total of only 19 songs were chosen, 11 of them by at least half of us. This made me think about social media and how we mostly end up interacting with people in our online communities. These communities are often formed by people with similar interests or points of view, much like our community here was based on track choices. This exercise showed me how confirmation biases and misinformation spread so easily on social media. If the tracks were articles that we shared with one another, some of the articles would be shared over and over, while others would not be mentioned at all. Imagine that the articles (tracks) not being shared held opposing viewpoints to the ones we chose multiple times. The people within our community could internalize the information in those articles without ever being exposed to an opposing idea. This analogy really helped me understand the importance of consuming news from multiple sources outside of social media.


Task 10: Attention Economy

While reading through the instructions, my first impression of Task 10 was that it sounded fun! As I navigated to User Inyerface and began the activity, my attitude quickly changed. I became incredibly frustrated within the first couple of minutes. After trial, error, and nearly twelve long minutes, I completed the process of creating my “account”. A small gif of a dancing Carleton helped me celebrate my achievement of navigating a nearly unnavigable user interface, and after a few calming breaths I was able to reflect on the design choices that made my experience so aggravating.

In Brignull’s 2011 article about dark patterns on the web, he discusses some ways that companies apply psychological insights deceptively (e.g. our tendency to scan a page for the important information). User Inyerface used this insight on the first page – I wanted so badly to click on the big green “no” button! I realized that no matter what the big green button said on it, I would probably want to click on it, which makes it a powerful design choice that could be used to manipulate responses. But of course, I went into the activity expecting to be fooled so I thought twice about clicking it. The link to the next page was hidden in an oddly-formatted sentence near the bottom of the page. It was unclear which of the words contained the link, so I ended up navigating to the next page by clicking indiscriminately on all of the words until something happened.

On the next page, I became irritated by the “hurry up” message that kept popping up. It took some time to figure out that the small copyright symbol at the bottom was intended to be the “c” at the beginning of the word “close”. There was no indication that the word was something I could interact with. There was also a certain amount of stress I felt while seeing the numbers ticking away and keeping track of how long I had been struggling with the interface. The stress of trying to do it quickly undoubtedly made me less effective at navigating the site. I can see how this would be useful for companies who will make more money if their customers are worried about navigating the site quickly as opposed to looking for small details that could save them money.

The inconsistent wording regarding the password requirements and suggestions made it difficult to figure out what kind of password was acceptable, which only increased my frustration. The requirement to include a letter in common with the email address would have been very suspicious if this were a real account registration. If someone wanted to hack an account, they would be one letter closer to guessing the password.

There were several other designs to the UI that bothered me, but I think the very worst was the last page where I had to click on images to prove I was not a robot. The first set of images asked me to click on all pictures with a bow. However, the images consisted of bows and arrows, ribbon tied in bows, and people bowing to one another. I arbitrarily picked one of the three types of bows and selected them all. When I submitted my answer, there was no feedback at all about whether I had chosen correctly and I was immediately asked to do the same exercise with a new set of equally ambiguous directions. After several iterations of this, I selected all the images and finally made it through. I feel that there are many ways that designers could use the ambiguity of the English language in a malicious way to confuse customers.

Overall, the designers of User Inyerface did an excellent job of keeping me on the site for much longer than it would normally take me to create an account. Just by trying to navigate an aggravating interface, I became aware of many subtle design choices that can help or hinder a user. It seems much easier to influence responses and capture the attention of a website user than I had previous realized.


Brignull, H. (2011). Dark Patterns: Deception vs. Honesty in UI Design. Interaction Design, Usability338.

Task 11: Detain/Release

During the Detain/Release simulation (Pocaro, 2019), I acted as a county judge who was tasked with deciding whether defendants should be detained or released at their bail hearing while awaiting trial. I attempted the simulation twice because the first time I realized I had entered the incorrect name, so I restarted with the correct name. I should mention that the first time, I was unable to complete the simulation because I released too many people who subsequently committed another crime and lost my position as a judge due to public opinion. I made it through the second time, but had nearly filled both my “jail capacity” and “fear” meters.

I found the simulation quite difficult and struggled with the choices. At first, I really wanted to release each person because of their statements about losing jobs, housing, or families. I kept thinking that if they were allowed to await trial at home with family or other supports, they might be less likely to reoffend. For example, if someone awaiting trial for robbery lost a lot of potential income while they were detained and awaiting trial, they would be more likely to commit another robbery once released due to their financial situation. However, the the simulation did not extend to what the defendant did or did not do post-trial. Therefore, in several of the cases where I released the defendant, they either committed another crime prior to their trial or were absent from their trial. This caused public fear.

The strongest influences in my decisions were the nature of the alleged crime (charges of rape, murder, and assault automatically made me more inclined to detain the person, even though they may have been innocent) and the projected risk of violence. Additionally, if the defendant had at least a medium risk in all of the three categories (flight, crime, violence) I was likely to detain them as well.

Considering the strong influence that the risk assessment algorithms had on my decision making, I think it is extremely important to understand how the risks are calculated. I am not certain how bail hearings normally progress or what information is made available to the judge, but based on my experience with the simulation, I think that I would want to have access to all the data that went into the risk assessment to be able to make a decision more confidently. Can we be certain that the algorithm is not discriminating against certain groups of people? Dr. Cathy O’Neil (2017) described several algorithms that reflected cultural biases, in some cases unfairly targeting black people, and I can’t help but wonder if this risk assessment algorithm is prone to the same mistakes.

Additionally, humans have motive for their actions, and this is not something that an algorithm could necessarily capture. For example, if someone commits a theft of food because their child is hungry, and is likely to commit the same crime again before their trial because their child needs to eat, should they be detained and lose custody of their child, get fired from their job, and miss out on time they could spend working on a defense? What another person is stealing wallets because they want money to support a gambling habit? Both people just show up as a “high” risk to commit a crime while awaiting trial. Do they deserve equal consideration for release? This brings about a whole bunch of ethical considerations, which I will not discuss here. My main concern is that algorithms may only account for the “what” but not the “why” of human actions, which only tells a part of the story.


O’Neil, C. (2017, July 16). How can we stop algorithms telling lies? The Guardian. https://www.theguardian.com/technology/2017/jul/16/how-can-we-stop-algorithms-telling-lies

Pocaro, K. (2019, January 8). Detain/Release: simulating algorithmic risk assessments at pretrial. Berkman Klein Center Collection. https://medium.com/berkman-klein-center/detain-release-simulating-algorithmic-risk-assessments-at-pretrial-375270657819

Task 8: Golden Record Curation

For the Golden Record Curation assignment, I attempted to represent as much human diversity as possible. I took into account the geographical location, gender, race, social status, and language of the musician. I also tried to include a sample of different instruments, music with and without lyrics, and music from different time periods where possible.

These are my selections:

  • “Dark Was the Night,” written and performed by Blind Willie Johnson. 3:15
  • Beethoven, Fifth Symphony, First Movement, the Philharmonia Orchestra, Otto Klemperer, conductor. 7:20
  • Navajo Indians, Night Chant, recorded by Willard Rhodes. 0:57
  • Australia, Aborigine songs, “Morning Star” and “Devil Bird,” recorded by Sandra LeBrun Holmes. 1:26
  • Peru, wedding song, recorded by John Cohen. 0:38
  • India, raga, “Jaat Kahan Ho,” sung by Surshri Kesar Bai Kerkar. 3:30
  • Japan, shakuhachi, “Tsuru No Sugomori” (“Crane’s Nest,”) performed by Goro Yamaguchi. 4:51
  • Senegal, percussion, recorded by Charles Duvelle. 2:08
  • Mexico, “El Cascabel,” performed by Lorenzo Barcelata and the Mariachi México. 3:14
  • Azerbaijan S.S.R., bagpipes, recorded by Radio Moscow. 2:30

Task 6: An Emoji Story

Task 6: An Emoji Story

I chose to describe the plot of one of my favourite feel-good movies. I had several reasons for choosing this particular film: I know the plot well, so it should have been easy to decide on which parts of the story were important to include; it has a cute cast of characters that can be represented by specific emojis; and it is well known enough that at least some of my classmates should be able to figure it out.

I started with the title, since it was straightforward and easy to represent with a single emoji. I then worked my way through story from beginning to end. My strategy was to assign each character a specific emoji, and then try to convey their actions and feelings using combinations of other emojis to give a general feeling or mental image of the story overall.

Task 4: Potato Printing

Potato printing and the supplies I used to create the print.

I chose to print the word PLANT in green acrylic paint on textured drawing paper. Initially, I wasn’t sure if I should capitalize the word as though it was at the beginning of a sentence or print it in upper- or lowercase letters. I settled on uppercase letters because straight lines are much easier to cut into the potato. After imagining how the letters should look, I realized that they needed to be cut facing backwards, which took more concentration than I thought it would. Because of this, I feel that the letters are less neat and tidy than they would be if I had been able to draw them facing forward.

The total time spent creating my stamps was about fifteen or twenty minutes. If I were to do the activity again, I would spend some more time on this step. Only after applying the paint and stamping the letters on the page did I notice that the cut surface of the potato was uneven. This led to the letters looking patchy because the paint was in crevices of the potato tissue and did not touch the paper initially. I attempted to remedy this by adding some more paint and pressing the potato down more firmly to the paper, which resulted in excess paint around the edges of the letters.

Having completed this exercise, I am very grateful for the mechanization of writing. It gave me some perspective on the immense amount of work it must have taken many people over many years to write and reproduce texts. When trying to reproduce the word for a second time, I became aware of how challenging it was to maintain spacing between the letters. The creation of technologies such as the printing press and typewriter eliminated this problem and allowed for pages of tiny, uniformly-spaced words that allowed for easier reading.


I’ve included a photograph of my potato garden from this summer. I liked the connection between using potatoes to print the word PLANT and showing an image of my plants that will grow new potatoes.