Geob 270 – Lab 3
Lab 3: In this lab, I was immersed in a scenario where I was hired by the City of Vancouver GIS department and I was tasked with preparing a map that highlights the areas in the city that are more at risk from a tsunami. This lab worked with spatial analysis, tables, and editing.
-
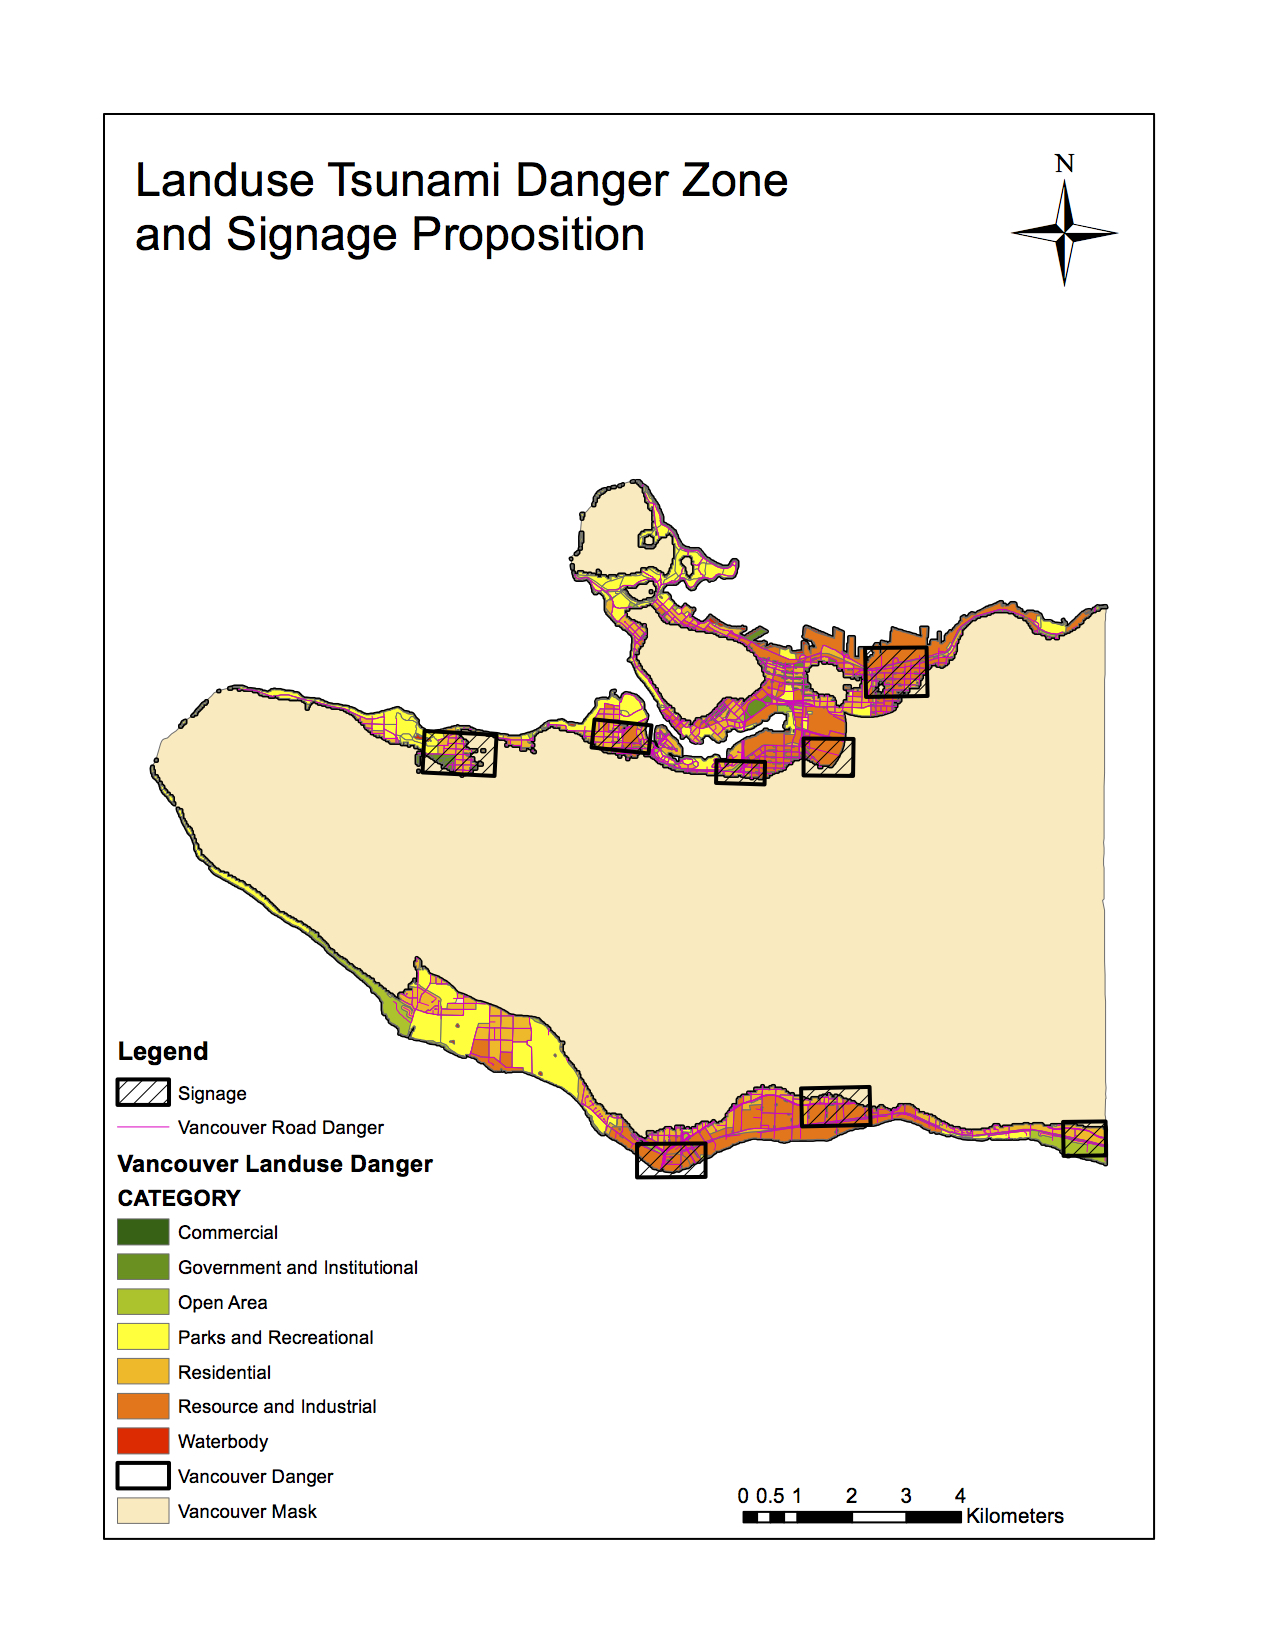
During this lab, we analyzed the Tsunami risk for the Greater Vancouver area. Using the data provided, I constructed a map that differentiated the land area in danger from the area out of danger. In ArcCatalog, I selected the Sum_Shape_Area tab for the Sum Output of Vancouver_LanduseDanger and right-clicked, then selected Statistics. I recorded the “Sum” value, then I opened the Attribute Table for the Vancouvermask layer. Using the proportion for the Shape_Area of Vancouvermask to the Sum of Vancouver_LanduseDanger to attain the percentage affected, which is 15.5%.
-
Continuing on in an analysis of this map, I was able to determine that there were certain institutions that were in the tsunami danger zone.
There are five health care facilities in the City of Vancouver’s danger zone:
- False Creek Residence
- Villa Cathay Care Home
- Coast west Community Home
- Broadway Pentecostal Lodge
- Yaletown House Society
And there are ten educational facilities in the danger zone:
- Emily Carr Institute of Art and Design
- Institute of Indigenous Governments
- Henry Hudson Elementary
- False Creek Elementary
- St. Francis Xavier
- Vancouver Montessori School
- St. John’s International
- Heritage 3R’s School
- St. Anthony of Padua
- École Rose des Vents
These results were attained by using the Select by Location function under the Selection tab.