Accomplishment Statement
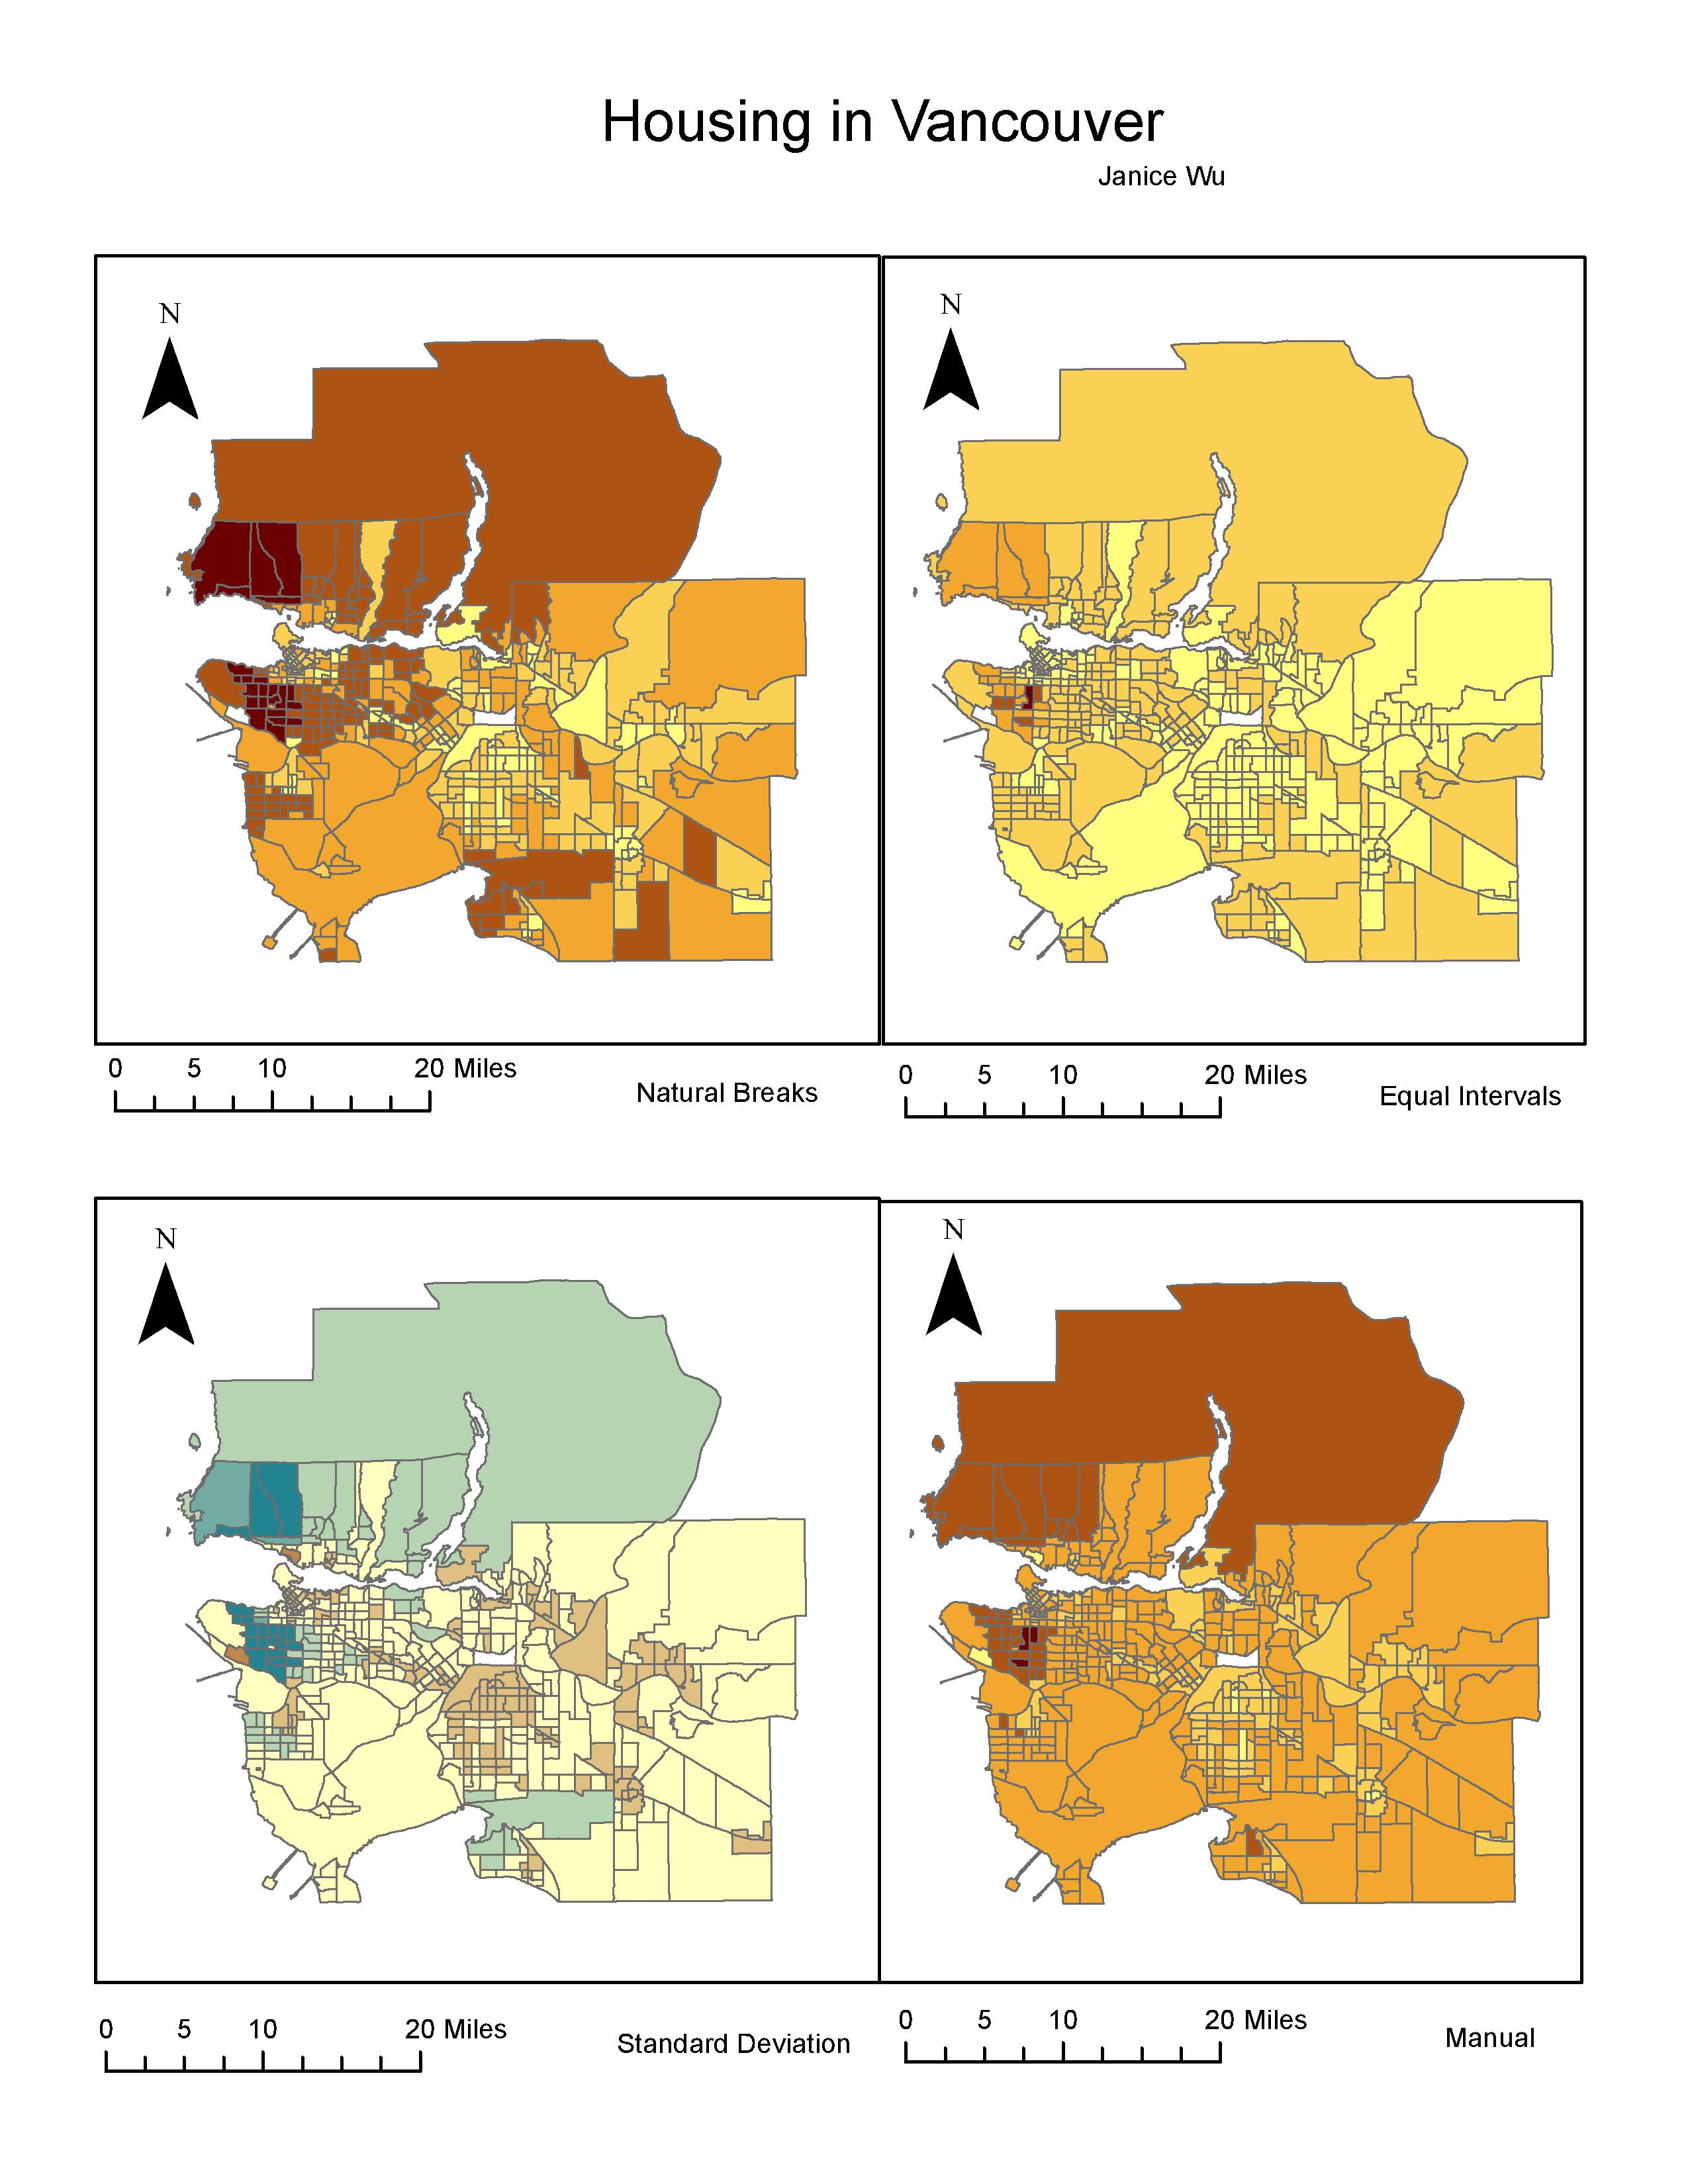
Deepened the knowledge of map classifications such as using equal interval, manual breaks, natural breaks, and standard deviation classification methods to show effective maps. Also, acquired data on reliable websites in order to perform the analysis.

The map above portrays the different data classifications that can influence the meanings given off by the maps. Natural breaks allows automatic groupings generated by the computer based on the data distribution and is also the default in ArcGIS. Equal interval has equal ranges between each class, but it does not look at the distribution in the data. Standard deviation looks at how far the values deviate from the mean, so it is excellent to use when data has a normal distribution. Manual breaks allows people to put in their own breaks, so that the map can be manipulated manually.
If I was a journalist, I would want to use natural breaks to present my data to the audience because it shows the greatest difference between classes, which is eye catching to the eyes and will appeal to the readers. Standard deviation is also good too because it can tell readers which parts of Vancouver deviates from the mean the most. If I was a real estate agent, I will be using manual classification because it does not show that the area right beside UBC is the most unaffordable. The area coverage of severely unaffordable housing are also a lot smaller. Also, I can modify the class ranges in manual classification in order to portray Vancouver catered to my client’s buying preferences. Ethically, I want to share the truths of unaffordability in Vancouver with my readers as a journalist. As a realty agent, however, depending on my practice, I would either show the maps that has or has not been modified.
Housing Affordability VS Housing Cost

Measuring housing affordability means to measure the relative cost to how much the purchaser is able to pay. It relates the cost to the income of the purchaser, making it a better indicator than housing cost alone. Housing cost, on the other hand, will compare the cost of housings to other aspects that cannot accurately portray its affordability at the time of the housing market.
Housing affordability rating categories
There are four different affordability rating categories determined by the 12th Annual Demographia International Housing Affordability Survey of 2016, which are listed as follows:
Affordable (3.0 and under)
Moderately Unaffordable (3.1 – 4.0)
Seriously Unaffordable (4.1 – 5.0)
Severely Unaffordable (5.1 and over)
Affordability Means Livability?
No. Vancouver is a great example of how cities can be livable, but not affordable. Livability is assessed with the quality of its environment, social stability, economy, opportunities, etc. As a city, Vancouver has great accessibilities to parks and recreations, social services, health services, etc. It has even been ranked as one of the most livable cities in the world on various news articles online. Hence, a livable city does not mean it is an affordable one. They denote two different meanings.