I’m still a little uncomfortable with navigating the matrix or matrices generated on Palladio. There is a lot going on and I am not quite sure if I’ve been able to grasp it all in a meaningful way just at a glance. So I decided to analyze the visualization generated and cross-check it with the information submitted in my classmate’s blogs to extract more meaningful connections (for me).

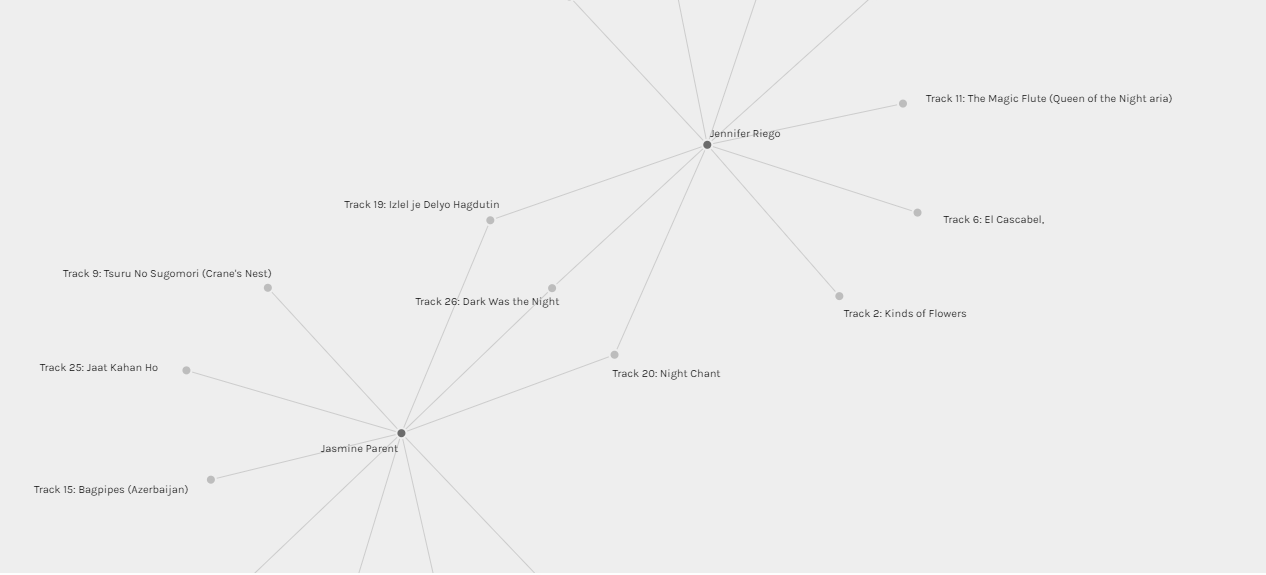
The first thing I checked was the group network generated based on the similarities in responses. To my surprise, the group I ended up in included only myself and one other student, Jennifer Reigo. We had 3 of our 10 choices in common: Night Chant (Track 20), Izlel je Delyo Hagdutin (Track 19) and Dark was the Night (Track 26). Reading Jennifers blog post for Task 8, I can see that we did have very similar mindsets when choosing our top 10. We both tried to choose pieces that were different – that used different musical modes and sounds and frequencies. I was very specific in choosing different tones and different instruments. It seems that Jennifer was as well. We also valued the idea that we wanted to steer away from depicting a monoculture and so made choices based on diverse communities. Jennifer broke her choices down into 3 categories: Imagination, Contexts and Communities. I liked how the 3 overlapping choices we had were represented in each of those 3 categories.

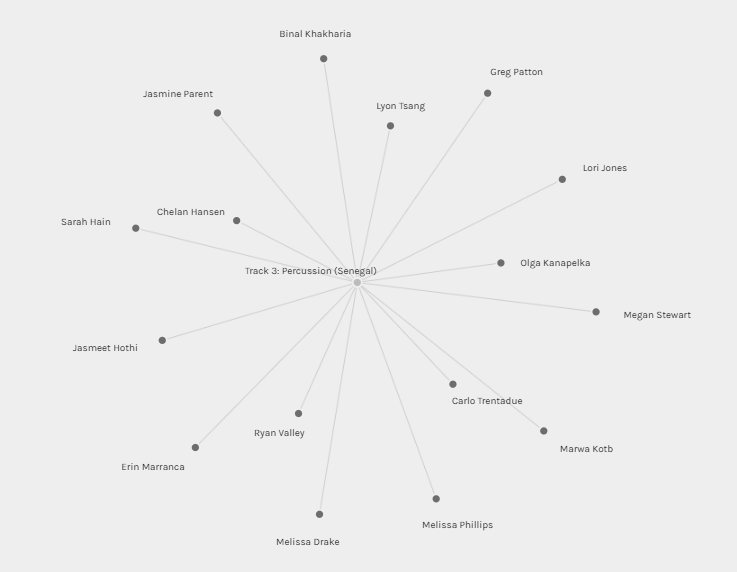
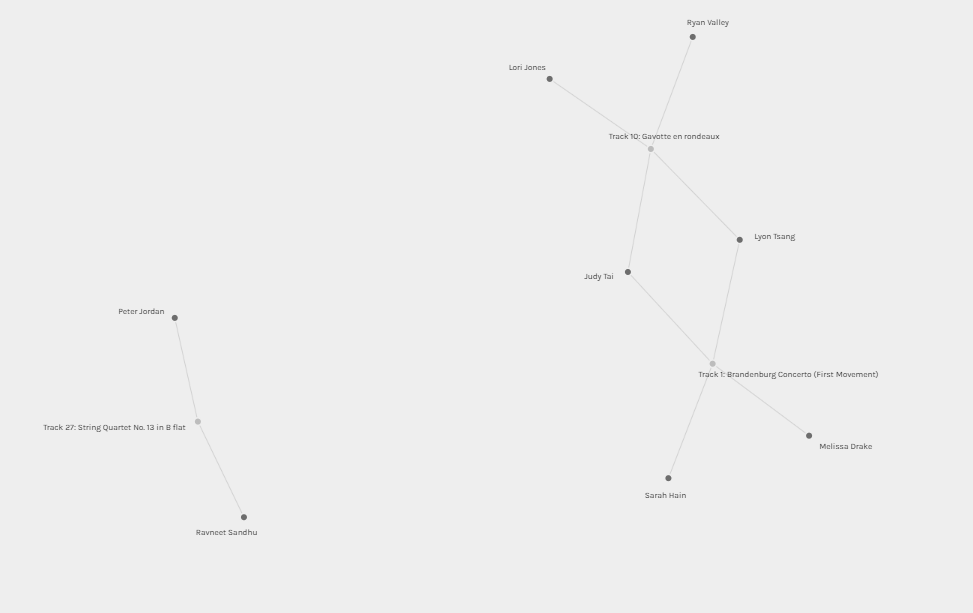
I then decided to explore the most chosen songs. It was interesting to me that even though the highest number of songs I had in common with another student was 3, I did also choose the top 4 most commonly curated songs. Additionally, I verified that I did not choose the 9 least chosen songs. So while it seems like my individual choices had some popularity among my peers, the combination of the songs I chose was quite different, giving me only a few students that I had 2 or more overlapping choices with.

I was quite pleased to see that of the top 5 most commonly selected songs, only one is from the western world. The top 4 songs originated in Senegal, China, Japan and India. In contrast, I noticed that the bottom 3 songs were classical pieces. One of my complaints was that there was an over-representation of classical music on the record. It seems that, as a group, my peers perhaps felt the same, even if some didn’t express it in their blog posts. “Can the reasons for these “null” choices ever be reflected/interpreted in the data?” Maybe not confidently. This is an assumption I am making based on my own experience and how the final outcome of the group data looked. I recognize that my own experience will influence my interpretation of the results in the visual.

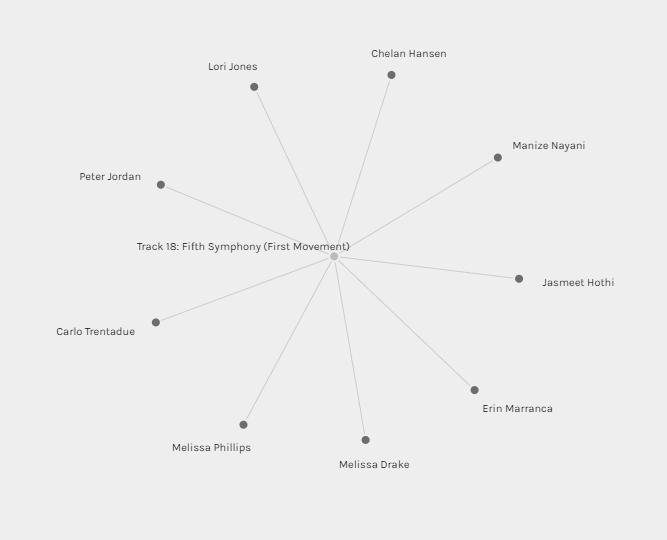
In the vein of classical pieces, I was curious to see what the most popular classical choice was. I was not surprised to see the Fifth Symphony as the most commonly chosen piece. I thought I had chosen it as well, so I was a little confused to see that it was not associated with my name in the matrix. This might have been a mistake on my part when completing the quiz. Nonetheless, I think many chose this classical piece because it is well known. Outside of this exercise, I would say that the Fifth Symphony is one of my favourite classical pieces ever composed (so let’s pretend that I did actually choose it in my top 10). I would like to make the interpretation that others chose it because it is so pervasive and timeless, but I don’t have enough information and so I am not confident in saying that is necessarily the case.
While I did find it interesting to see the connections, similarities and differences in our choices from the Golden Record, I also felt like I had to proceed with caution when making assumptions about my classmate’s choices. I was more confident relying on their thoughts expressed in their blog posts than on the visualization alone. There were assumptions I came up with, based on the matrix, however, I recognize that they are only assumptions and not fact or reality. Furthermore, I recognize that the assumptions I tend to make are based on my own experience and reflections about the choices I made.
