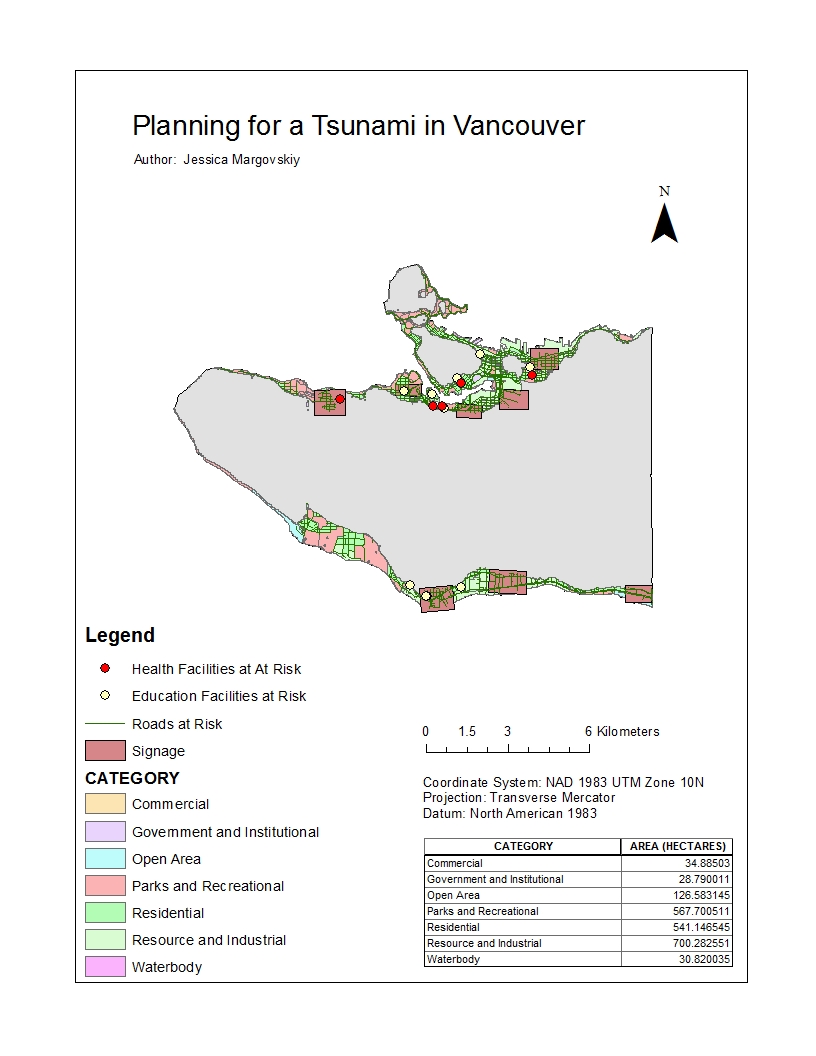
Accomplishment: Using the Intersect tool, I created a vector layer that satisfied areas within greater Vancouver susceptible to a tsunami both within 1 km buffer and with less than 15 km elevation, to show where it is most dangerous to reside if a tsunami were to hit.
Percentage of the City of Vancouver’s total area is affected by the potential Tsunami:
20302078.291706 / 131033339.950334 * 100 = 15.5%
Taking the sum of all categories from the Vancouver_Danger_Intersect, and dividing that by the total sum of Vancouver’s total area, that being the Vancouvermask area, and multiplying by 100, I was able to find a percentage.
Health care and educational facilities within the City of Vancouver danger zone:
Using Select By Location, I created a new layer for both Health and Education, with the source layer being Vancouver_Danger. By doing so, I found where health points and education points overlapped onto areas of Danger:
| Health Facilities Affected: | Education Facilities Affected: |
| FALSE CREEK RESIDENCE | EMILY CARR INSTITUTE OF ART & DESIGN (ECIAD) |
| VILLA CATHAY CARE HOME | INSTITUTE OF INDIGENOUS GOVERNMENT (IIG) |
| COAST WEST COMMUNITY HOME | HENRY HUDSON ELEMENTARY |
| BROADWAY PENTECOSTAL LODGE | FALSE CREEK ELEMENTARY |
| YALETOWN HOUSE SOCIETY | ST FRANCIS XAVIER |
| VANCOUVER MONTESSORI SCHOOL | |
| ST JOHN’S INTERNATIONAL | |
| HERITAGE 3R’S SCHOOL | |
| ST ANTHONY OF PADUA | |
| ECOLE ROSE DES VENTS |