London Congestion Pricing System

London Congestion Pricing System

A good method to solve the urban traffic problem

Background

Traffic congestion in central London is a historical problem for this old city. In 1995, the London Congestion Research Program inferred that with a congestion pricing system, the city’s economy would benefit a lot. And later in 2000, Ken Livingstone first formally presented the system to the public in his London Mayoral Election manifesto. In order to reduce congestion and to increase investment funds for London’s transport system, the Congestion Pricing system was introduced on 17 February 2003.


Policy Principle


  • Coverage and exemption

According to this charge system, most motor vehicles driving within the Congestion Charge Zone (CCZ) in central London between 07:00 and 18:00 Monday to Friday need to pay the congestion fee. Weekends, public holidays or between Christmas Day and New Year’s Day (inclusive) are exemptions. The charge area includes one of the world’s largest congestion charge zones and the Western Extension (operated between February 2007 and January 2011). The charge operates for under one third of the hours in a year and covers around two thirds of the central London traffic.[1] Registered cars which emit 100g/km or less of carbon dioxide and meet the Euro 5 standard, vehicles with 9 or more seats, motor-tricycles, accredited breakdown companies and roadside recovery vehicles receive 100% discounts.[2]


  • Current Charging Standard

The standard fee for applicable vehicles is £10 per day if paid by midnight on the day of travel, £12 if paid by the end of the following day, or £9 if registered with CC Autopay.Businesses with ten or more vehicles can register with Transport for London (TfL), and will be charged £9 per vehicle per day for each vehicle detected within the zone.[3] Failure to pay results in a fine of £120, reduced to £60 if paid within 14 days, but increased to £187 if unpaid after 28 days.[4]


  • Refunds and The Use of Surplus

Refunds are available to people who pay monthly or annual in advance whose plans change; reimbursements are available to NHS patients assessed to be too ill to travel by public transport, NHS staff using vehicles on official business and fire fighters.[5] By law, all revenue must be reinvested into London’s transport infrastructure.


 Effects

  • Traffic change

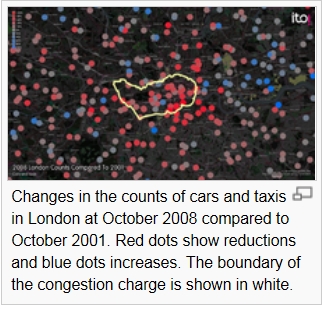
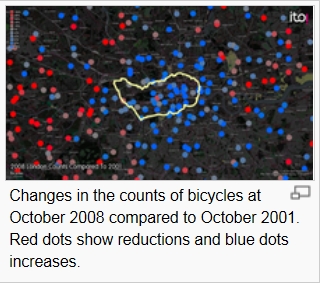
1) Traffic volume: In 2007, TfL found that “the number of chargeable vehicles entering the zone had reduced by 30%, while there were overall increases in the numbers of taxis, buses, and especially bicycles.” However, traffic congestion during the morning peak had not reduced.

* Transferred from en.wikipedia

2) Traffic speed

Without the policy, TfL estimated the speeds would have dropped from 17 km/h in 2003 to 11.5 km/h by 2006. A report by TfL in early 2007 indicated that there were 2.27 traffic delays/km in the original charging zone while before the number is 2.3.


  • Air quality

In 2011, Health Effects Institute (HEI) found that there is little evidence the congestion pricing system has contributed to the air quality.

Charging zone Inner Ring Road
NOX PM10 CO2 NOX PM10 CO2
Overall traffic emissions change 2003 versus 2002 −13.4 −15.5 −16.4 −6.9 −6.8 −5.4
Overall traffic emissions change 2004 versus 2003 −5.2 −6.9 −0.9 −5.6 −6.3 −0.8
Changes due to improved vehicle technology −17.3 −23.8 −3.4 −17.5 −20.9 −2.4

* Source: Transport   for London 2003–2004 figures are TfL estimates.


  • Parking Issues: In order to avoid the congestion fee, many citizens choose to park their cars in outer London district, which causes new on-street parking issue.


Policy Evaluation and Conclusion

  • Benefits and Cost Analysis

Initially, Tfl expected that the surplus of this system would be around £200 million. According to a report issued in February 2007, “the initial costs of setting up the scheme were £161.7 million, with an annual operating cost of about £115m anticipated. Total revenues over the first three and a half years had been £677.4 million, with TfL reporting a surplus over operating costs of £189.7 million.” What’s more, the Bow Group claimed that by 2007 the policy had only returned an approximate £10 million profit.


The initial operating revenues from the scheme did not meet the levels that were originally expected. Within six months from the beginning of the policy, the reduction in traffic had been such that TfL were anticipating a £65 million revenue shortfall.


Revenues (£m) provisional

2004/5

2005

2006/7

Standard daily vehicle charges (currently £10) 98 121 125
Enforcement income 72 65 55
Fleet vehicle daily charges (currently £7) 17 19 27
Resident vehicles (currently £4 per week) 2 2 6
Other income 2
Total revenues 190 210 213
Total operation and administration costs (92) (88) (90)
Net revenues 97 122 123


Expenditure (% of operating   revenue)

2004/5

2006/7

Bus network improvements (incl. vehicles, garages &   shelters) 80% 82%
Road and bridge maintenance & upgrades 11%
Road safety (incl. research & campaigns) 11% 4%
Walking & cycling programmes & publicity 6% 2.5%
Distribution and freight (incl. review of a London lorry   ban) 1%
“Safer routes to schools” initiative 2%

*Source: Impacts Monitoring – Third Annual Report” (PDF). Transport for London. April 2005.

  • Conclusion

In general, this congestion pricing system is fairly effective. It achieved its original goal to some extension. This policy truly reduced the total urban traffic volumes and increased the traffic speed.


However, this system is still immature. On one hand, during the morning peak time the congestion issue still exists. On the other hand, economically speaking, according to the revenue report we can see clearly the initial operating revenues from the congestion charge did not meet the levels that were originally anticipated, which means the policy is costly. What’s more, the scheme is not flexible to the change in weather or emergency, so that it’s unfair to the taxpayers.


Therefore, in order to solve this fault, I suggest the Tfl should introduce a more complex system which charges drivers according to the congestion degree of the road rather than the uniform time and districts. And of course, they also consider more how to reduce the operating cost to get their maximum profits.


Reference

[1] Impacts Monitoring – Fifth Annual Report. Transport for London. June 2007.

[2] Discounts and exemptions. Transport for London. 13 April 2012.

[3] When to pay. Transport for London.

[4] Penalties and Enforcement.  CCLondon.com. Transport for London.

[5] Transport for London Refunds and reimbursements. Transport for London. 13 April 2012.

[6] Wikipedia, http://en.wikipedia.org/wiki/London_congestion_charge#Parking_issues_in_outer_London

Week 9: The road ahead

Soybean price will go down

I predict soybeans will fall again on reports that China canceled previous purchases as improved planting progress in South America boosted potential for record crops.

China, the world’s biggest soybean consumer, canceled 10 cargoes totaling 600,000 metric tons, Commerzbank AG said today in an e-mailed report, citing the country’s National Grain and Oils Information Center. Rain followed by dry, warm weather will aid planting and early crop development the next two weeks in parts of Brazil as dry weather eases flooding in Argentina for sowing, World Weather Inc. said in a report.

” ‘Reports of China canceling soybean imports put the market on the defensive,’Chad Henderson, the president of Prime Agricultural Commodities Inc. in Brookfield, Wisconsin, said in a telephone interview. ‘Right now, there are fewer worries about the potential for record crops in South America.’ ”

Soybean futures for January delivery dropped 1.3 percent to close at $13.8325 a bushel at 2 p.m. on the Chicago Board of Trade, after touching $13.7225, the lowest since June 22. And after a slight  rise last week, next week the price will continue to fall.


Week 9: What went right

This week my equity increased from $39071.77 to $39584.47. The key point is the golden principle—“Buy Low Sell High”.

The form below shows the movement of my trading account during this week.

Date Symbol Status Price in Price out Gain/Loss
10.18 W4K Short 860.25
11.15. W4K Offset 860.25 855.5 +237.5
11.16. S3F Long 1368
W4H Long 848

1. Why go long soybeans on Nov.16th

The USDA’s November forecasts of the size of the 2012 U.S. corn and soybean crops were larger than expected, particularly for soybeans. As a result, the general downtrend in soybean prices since mid-September has accelerated, with January futures now at the lowest level since June 29.

Because of this news, last two weeks the price of  soybeans has experienced a big drop. So I thought   the speculator way to picking the bottom of falling markets.


2.  Why go long wheat on Nov.16th

On Nov 15th , there is a news that U.S. wheat feed and residual usage will reach 315 million bushels this year, far surpassing the 150 million-bushel average for the last 10 years. That means wheat for Livestock Feed Estimated to Rise Sharply. ( According to World Agricultural Supply and Demand Estimates (WASDE) referenced by Lisa Elliott, a commodity marketing specialist and assistant professor at South Dakota State University. )

So I went long on wheat expecting to pick the bottom of falling wheat markets too.


Week 9: Cool resource

1. http://www.usda.gov/oce/commodity/wasde/   It is easy to find that many reporters expect future price based on this information. It is World Agricultural Supply and Demand Estimates (WASDE) report provides expected supply and demand for not only U.S. but also global crops and livestock. In addition to literature on price, this report gives statistic data published by USDA and other government agencies.  It is better idea of keeping eyes on the report, and use it when you trade.

2.”Trading Places”

The film tells the story of an upper class commodities broker and a homeless street hustler whose lives cross paths when they are unknowingly made part of an elaborate test of nature vs nurture by wealthy Duke brothers. It’s a great explanation of what we learnt in class.

Week8: The road ahead

The futures market reflects expectations that prices will continue to decline, especially into the 2013-14 marketing year.  The expected rebound in South American soybean production, Argentine corn production, and U.S. corn and soybean production in 2013 all contribute to the expectation of lower prices.  If those crops are as large as generally expected, prices will be even lower than currently reflected in the futures market. The USDA is forecasting record South American production of both crops.

“If planted acreage of corn in the U.S. in 2013 is at the same level as in 2012 and the U.S. average yield is near a trend value of 162.5 bushels, the crop would total 14.6 billion bushels, about 1.5 billion larger than the record crop and record consumption of the 2009-10 marketing year.  Similarly if soybean acreage is maintained at the 2012 level and the average yield is near the trend value of 43.8 bushels, the 2013 crop would reach 3.34 billion bushels, near the record levels of 2009 and 2010.  A combination of record, or near record South American and U.S. crops in 2013 would likely push prices down to or below the long term averages of about $4.75 for corn and $11.00 for soybeans.”(www.agprofessional.com )

On the supply side, the progress of the South American crops will be most important for the next three months.  Weather conditions are currently improving somewhat from early wet conditions in Argentina and dry conditions in central and western Brazil.  Some on-going dryness is noted in southern Brazil and Paraguay.

Prices will also be influenced by the on-going rate of consumption of the 2012 U.S. crops.  For corn, there is some anticipation that the pace of export activity, which has been extremely slow to date, may accelerate as South American supplies dwindle and Asian customers return to the U.S. market.

Week8: What went right

This week my equity increased from $33063.01 to $39071.77. Despite paying close attention to the market, technological analysis method helped a lot this time.

The form below shows the movement of my trading account during this week.

Date Symbol Status Price in Price out Gain/Loss
11.7. S2X Short 1505.5
W2Z*2 Short 891
C2Z Short 744.5
11.10. S2X offset 1412.5 +4649
W2Z*2 offset 890 49*2=+98
C2Z offset 731 +674


The crop trade market experienced a bearish time.  Based on the fundamental analysis, the USDA’s November forecasts of the size of the 2012 U.S. corn and soybean crops were larger than expected, particularly for soybeans.  As a result, the general downtrend in soybean prices since mid-September has accelerated, with January futures now at the lowest level since June 29.  Corn prices have moved into the lower half of the trading range that has been in place since mid-September and December futures are at the lowest level since September 28.  So far, prices seem to be following the classic pattern associated with small crops –peaking early in the marketing year and then declining as the year progresses.

Based on the technological analysis (given by Andrew’s lecture),from the graphs (decreasing triangles) below, we can also see the declining trend clearly.

Week8: Cool resource

1. Agprofessional:

http://www.agprofessional.com/

This is a very useful website for trader to view the latest news. In the “resource center”, there is several major crops’ information there, like corn, wheat and soybeans. It’s convenient for us to search related information for making decision.

And this website also has an interesting and useful part–”web poll”.  If you are not sure what other speculators are thinking, you can submit this questionnaire to see the statics.


2. Farm Futures:

http://farmfutures.com/main.aspx

i.e. Soybean Selling Threatens Bigger Break

(www.farmfutures.com/story.aspx/soybean-selling-threatens-bigger-break-17-64844 )


Week7: Cool resource

1. UNCTAD: data analysist

http://www.unctad.info/en/Trade-Analysis-Branch

The Trade Analysis Branch (TAB) of the Division on International Trade in Goods and Services, and Commodities undertakes policy-oriented analytical work aimed at improving the understanding of relevant and emerging issues in international trade.

2.Farmjournal

http://www.agweb.com/farmjournal/

This website has the latest news of the agriculture market. And the weather report on this website is very useful.

Good luck!


Week7: The road ahead

On Sept.4, Soybean prices reached a peak, the price of that contract declined to about $15.50 by the end of September and has been in a range of $14.86 to $15.74 since then. The price is currently in the lower half of that range.

The generally sideways pattern for soybean prices over the past month reflects conflicting fundamental factors. The most supportive factor has clearly been the very strong export pace. U.S. exports will be restricted to some extent this year due to the smaller supply.

On Nov. 9,USDA will release a new production forecast and a final estimate on January 11, 2013. On the other hand, the market anticipates a rebound in South American soybean production in 2013 that will provide ample supplies to support the increased pace of world consumption and to provide for exports of soybeans and soybean products to the U.S. if needed.

USDA currently forecasts 2013 South American production at a record 5.449 billion bushels, 1.212 billion larger than the 2012 harvest. That forecast will be updated monthly beginning on November 9.

The larger production expectation will be reflected by the lower price of soybean futures for the last half of the 2012-13 U.S. marketing year. Now, let’s wait for the Nov. 9th report.


Week7:What went right.

This week my equity increased from $ 28429.91 to $33063.01.

The main gain is due on my close interaction with the market.

The form below shows the movement of my trading account during this week.

Date  Symbol Status Price in Today’s Price Gain/Loss
10.29. S2X Short 1541.5
  W4K Short 860.25
10.31 S2X offset 1541.5 1539.5 +99
  S2X*4 long 1539.5
11.1. S2X*4 offset 1539.5 1562 1124*4=+4496


1. Movement1 Short on soybean (10.29.)

Last week soybean experienced a big increase. So I held the short contract expecting it will turn to decrease this week.

What enhanced my speculate is that there is a news saying on 29th Oct, “Soybeans fell for a third session in Chicago as rains forecast for this week in South America may help improve growing conditions.” (http://www.businessweek.com/news/2012-10-28/corn-soybeans-decline-as-rains-may-boost-brazil-crop-prospects)According to my analysis, the market is looking at right now is the crop and planting conditions on Brazil and Argentina, so the rains forecast in Brazil may be pushing prices a bit lower.

As expected, the price of soybean plunged at the beginning of this week.

2. Movement2 Long on soybean (10.31.)

A nice shot on 10.31.!

After 2 days’ falling, the price of soybean rises again. These days I paid close attention to the trade market. Considering the psychological activity of the speculators,  I offset the short contract and went long on the soybeans.