Scenario Prompt: Describe or narrate a scenario about a corporation found a decade into a future in which society as we know it has come apart. Your description should address issues related to algorithms and elicit feelings of embarrassment.
My Scenario:
It is the year 2035, and a deadly, highly contagious disease carried by raccoons has forced entire nations into indefinite quarantine. Seven years have passed since the outbreak in 2028, and in that time, international travel has ceased, and once-thriving cities stand eerily silent. The only movement in the streets comes from motorized delivery robots (created by a joint effort between Tesla™ and Amazon™), transporting groceries and other essentials to those trapped in isolation.

With face-to-face meetings deemed too dangerous, human interactions exist solely in the digital realm. Accordingly, social media usage has surged to unprecedented levels, and Facebook’s Metaverse™ has been revived due to this ‘new normal.’ In this system, one’s worth to society is judged by the number of followers and likes that they receive, and images generated by AI are used as avatars to represent those behind the headsets.
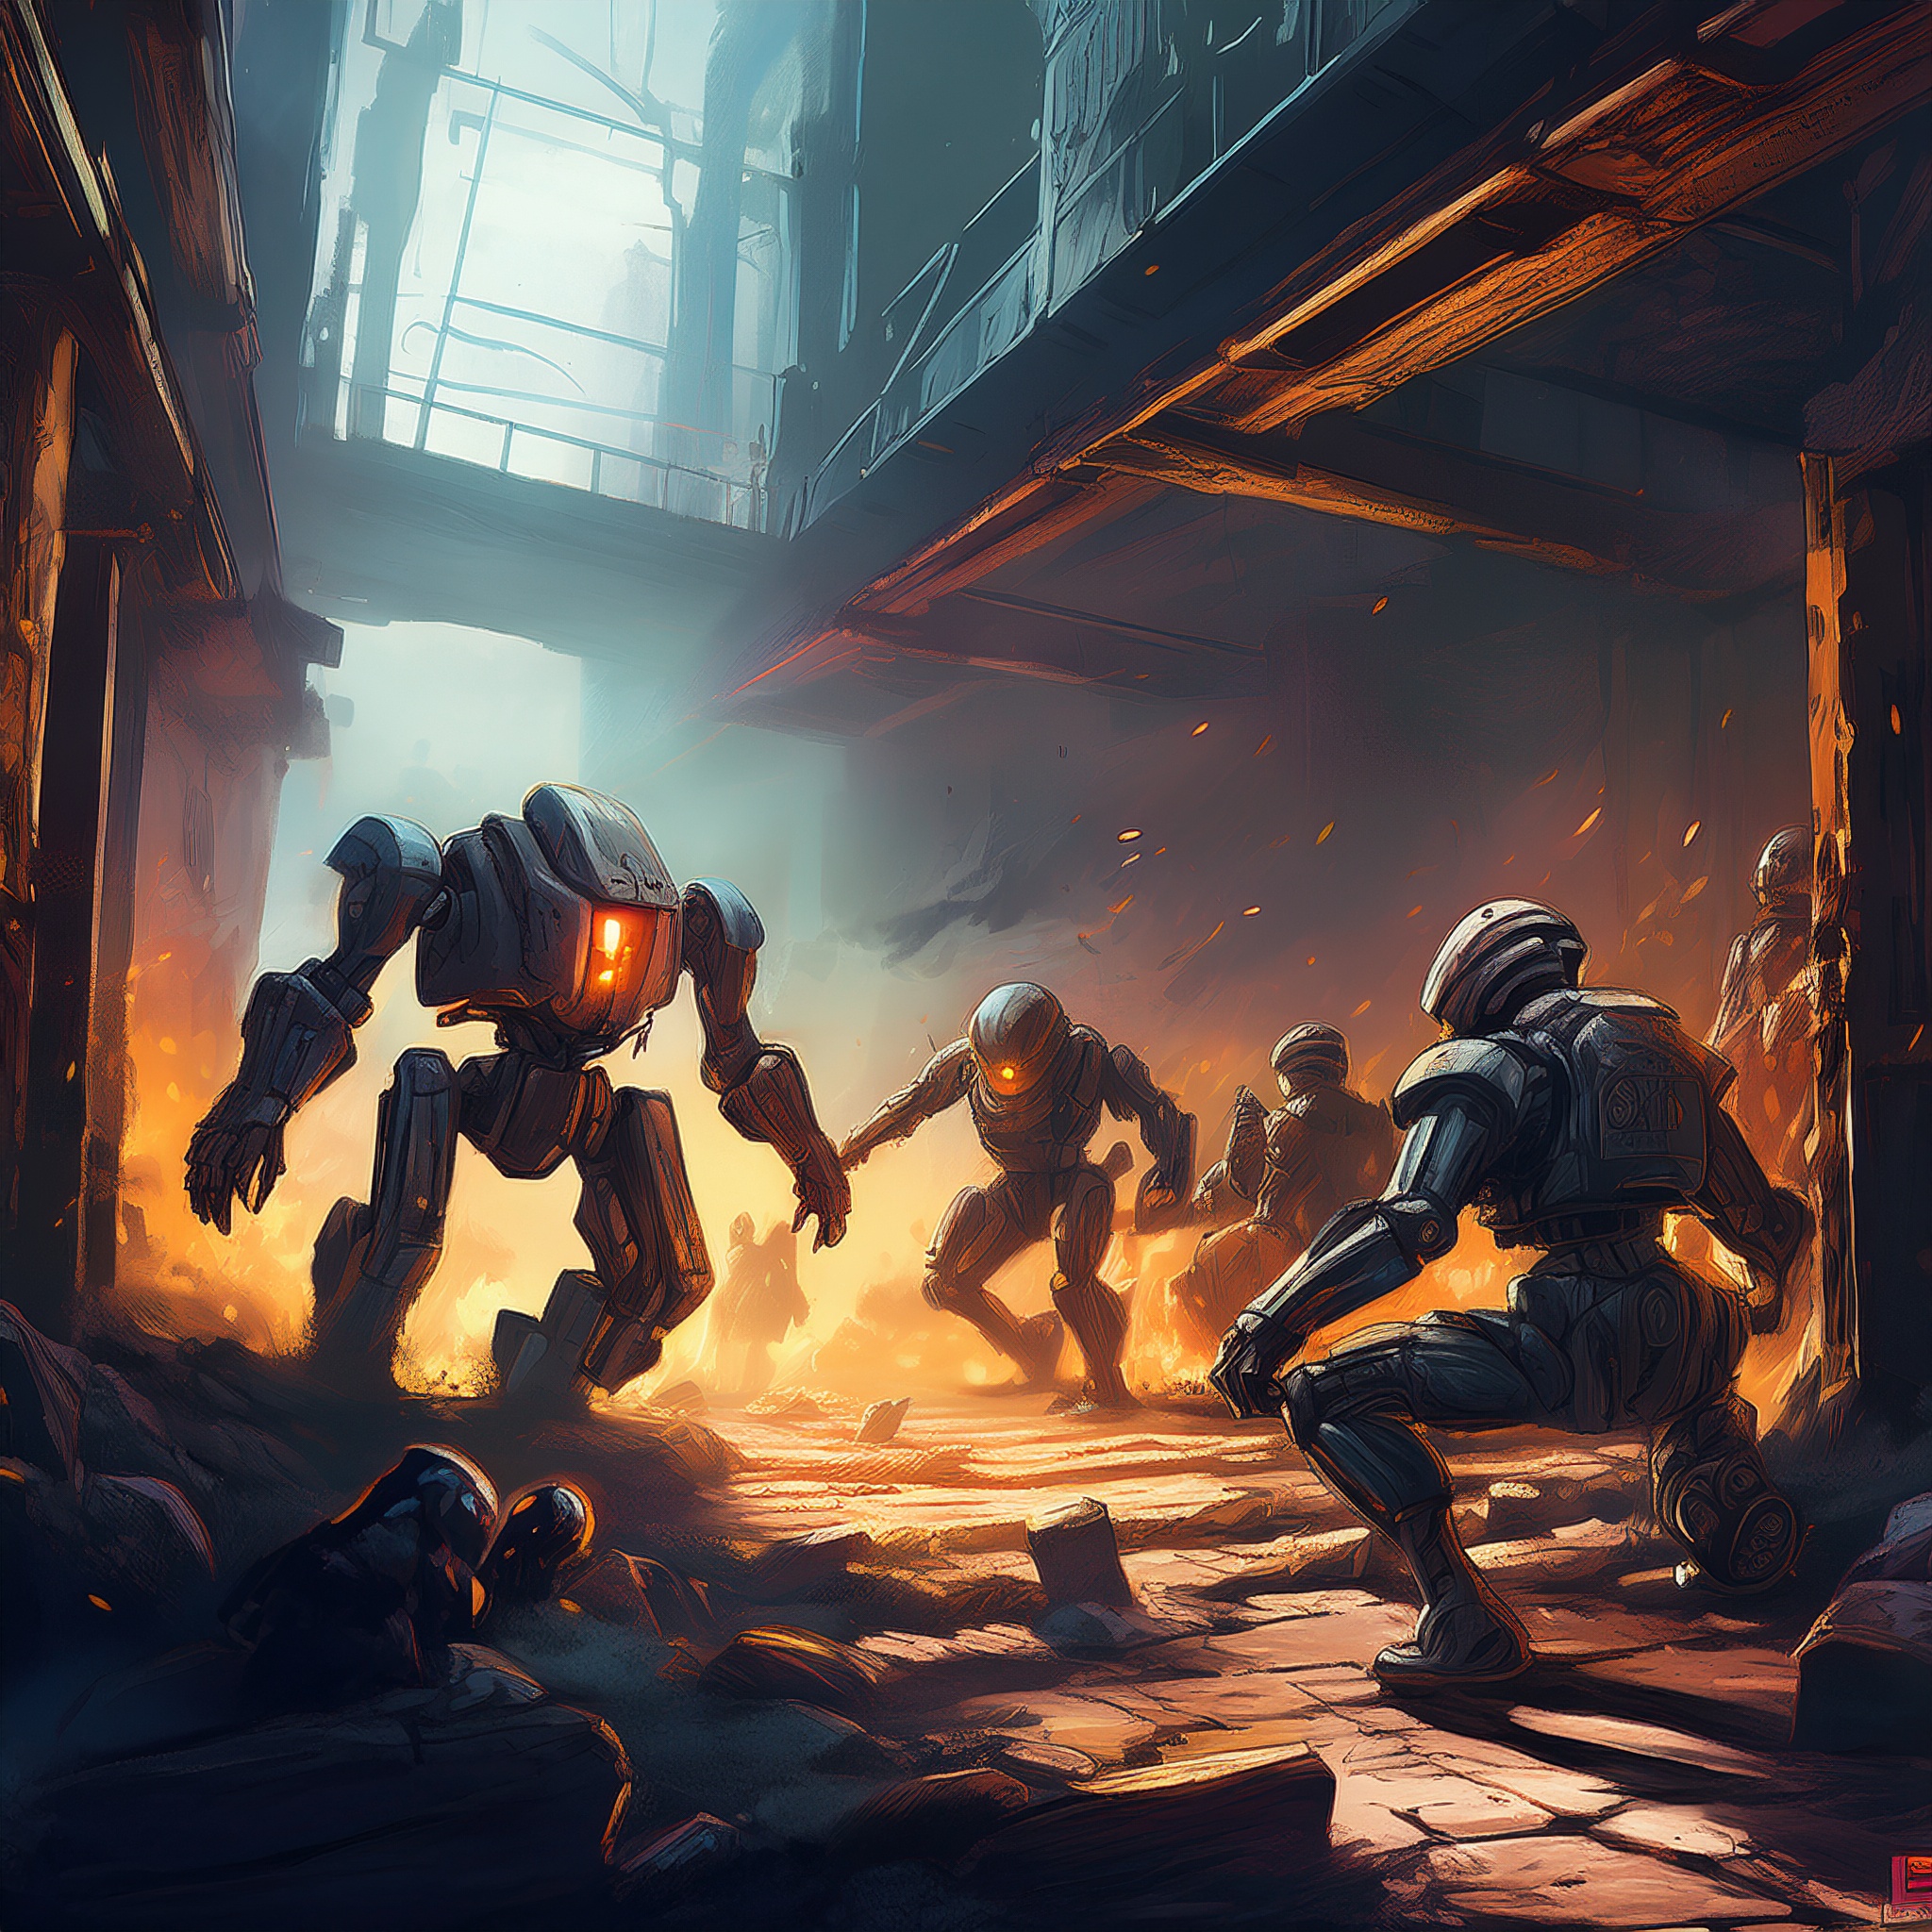
![]()
Complicating matters further, a feature recently added to the Metaverse™ is a dating function that uses algorithms to pair couples together based on their personal profiles. Marketed as a solution to the loneliness caused by the pandemic, this feature quickly gained traction, with millions signing up in hopes of forging genuine connections. However, as users navigated this new digital dating feature, it quickly became apparent that those with higher follower counts received significantly better matches, while lesser-known individuals were ignored. This stemmed from the motivation of Facebook to maximize their revenue, and the more popular accounts often attracted advertising from other companies. Coincidentally, AI bots generated by corporations to astroturf their commercial goods comprised many of those in this prioritized group.

Embarrassing situations emerged where humans went on ‘dates,’ only to discover that it was a bot on the other side rather than a real person. Some were unconcerned with this, accepting any form of romantic connection, while others felt betrayed and even more isolated as it became difficult to ascertain who was human and who was not. Online debates also erupted among academics over what truly constituted “human,” as interactions now solely existed in the digital world.
Meanwhile, underground resistance groups formed, seeking to dismantle the Metaverse™ and reconnect people in the physical world, despite the dangers posed by the virus. They believed that real human connection was worth the risk, even as governments and corporations pushed for deeper entrenchment in the digital realm. In secret chatrooms, they planned their next moves, hoping to remind society of what it had lost before it was too late…
Reflection:
As I wrote this short story, I found myself exploring the kind of possible future that Dunne and Raby (2013) describe, one that isn’t a straightforward prediction but instead a way to reflect on our present and where we might be headed. I wanted to exaggerate existing trends, like our growing dependence on AI and the gamification of social value, to highlight how technology could shape our identity in unsettling ways. Dunne and Raby argue that many of today’s problems can’t be solved just with new inventions, we actually need to change our values and behaviors (p. 2). Accordingly, in the world I created, people aren’t just adapting to technology. Instead, they’re being reshaped by it, losing sight of real human connection in favor of digital validation. Writing this also made me question: If we keep prioritizing convenience, economic growth and efficiency above all else, what do we risk losing?
At the same time, I didn’t want to paint a totally dystopian picture, I wanted to leave space for resistance and the possibility of change. Dunne and Raby talk about how speculative design is also about opening up conversations on what futures we actually want (p. 6). That’s what the underground groups in my story represent: people pushing back against the idea that this tech-driven reality is inevitable. The fact that some characters are content dating AI bots, while others are horrified, also ties into their point that “better” means different things to different people (p. 3). To some, a fully digital life might seem like progress, but to others, it’s a nightmare. Writing this helped me realize that our current path isn’t set in stone. There are always alternatives, and it’s up to us to decide which direction we want to take.
References
Dunne, A., & Raby, F. (2013). Speculative everything: Design, fiction, and social dreaming. The MIT Press.
Images Generated by Adobe Express
2 Comments