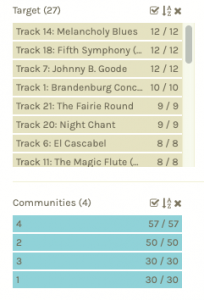
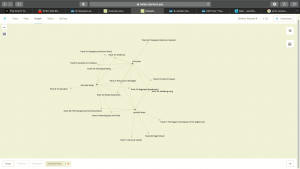
I was surprised to see myself in a smaller community. I chose the top three most popular songs and seven of the top ten songs. It seems that community four is more based on the unique songs we chose compared to the larger group. We all chose track 15: Bagpipes (Azerbaijan) which is outside of the top ten (and only one person outside our community chose it) and track three: Percussion (Senegal), which is number nine for the whole class. It is interesting that I chose based on diversity and Emily Wu (2022) chose based on “Exploring and Adventure” and we still chose 5 songs in common. I also found it interesting that in the class graph my dot is not adjacent to those in my community (maybe due to graph best fit). Below are screenshots of the class top eight songs, my dot within a part of the class graph and my community graph.
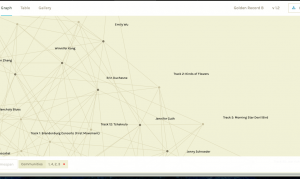
Visualization can allow us to see what songs are in common and assume potential rationale but cannot allow us to know the rationale behind the links as this requires an explanation of the rationale from the person who made the choice (which we handily have from task 8). This assignment also reminded me of an article where they created a similar graph of teen romantic and sexual relationships in a rural high school and found 52% of the students were interconnected (Bearman et al, 2004). Similarly we might infer things from the graph but unless we got further information from the students we cannot determine the true rationale. I wonder if we all picked songs based on the same criteria, it would lead to more interesting discussion on whether or not a song was included.
Null choices could be visualized in a closed data set like this one but not in an open data set where choices are limitless and rationale could be assumed or inquired about if we chose to focus on it. I was surprised that only one song was chosen by only one person (Pygmy Girl’s Initiation Song). I could infer that this was due to the short length, the lack of instruments or simply that other songs were preferred. For myself I was trying to get a song per continent and preferred track three from Senegal as it had instruments and I had already selected other chants.
Using Palladio to visualize data was helpful and I liked the ability to filter and switch between graph and table formats. I think connections would be more insightful if we did this on the “what is in your bag” assignment as the items are more personal or chose the music solely based on what we personally liked.
References
Bearman, P. S., Moody, J., & Stovel, K. (2004). Chains of affection: The structure of adolescent romantic and sexual Networks1. The American Journal of Sociology, 110(1), 44-91. https://doi.org/10.1086/386272
Wu, E. (2022, July 7). Task 8 – Golden Record Curation. Text Technologies: The Changing Spaces of Reading and Writing. https://blogs.ubc.ca/etec540emilywu/2022/07/07/task-8-golden-record-curation/