
- Metadata is data about data.
- Project “On the Fly” matches the feature class with the coordinate system of the map, in our case the projected coordinate system. However, the new feature class is not in that map’s coordinates system, so make sure you set it into the right coordinate system. It doesn’t change the feature class’ underlying data properties. It uses a transformation to transform the original layer coordinate system to the map’s coordinate system. Project “On the Fly” is good for visualizing data on the same map but if you want to do anything with the analysis you have to change the properties of that feature class.
- 10 N – 1
- – Inuvik, NWT, Canada: UTM Zone 8 N – Cape Town, South Africa: UTM Zone 34 S – Kyoto, Japan: UTM Zone 53 N
- Square Meters – 1
- 41118591 – 3
- 41118591000000 – 1
- 0.72 – 5
- 3.72 – 5
- The CAN_albersEA layer has a greater population density than the CAN_webMercator. This is because the Mercator map distorts the area of Canada and therefore gives us a not-so-accurate result. The most accurate population density would be the Alberta conic projection because it preserves the area of Canada better than the Mercator projection and area is needed to calculate population density.
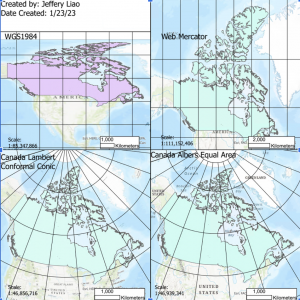
- The differences between the coordinate systems include whether it is distorted like the Mercator projection or keeps the entire area like the conic projections. For example, in the WGS1984 the map preserves shape but does allow for shearing, for the Mercator projection it keeps shape and angles but allows for compression. For both, Canada lambert and Albers equal area, it keeps area but allows for just a little bit of shearing the farther away from Canada you go. All the maps have tearing in them. Also, the meridian lines converge at the North pole, which is not shown on the Mercator map. If you wanted to map population totals by province, you would use the Lambert conformal conic projection because the shape of the provinces would look nice, and you can easily so which province is which. Also, the map is a well-known map so people can recognize it easily. If you wanted to map population density by province, you would use the Albers projection. This is because the projection retains the same shape as the “Earth’s” surface, and population density needs the correct area.
- The UTM projection is used to map small narrow areas on Earth’s surface and doesn’t work well mapping bigger countries like US and Canada. Since UTM projection is a planer projection, it has a tangent parallel at one specific area, so, therefore, that area is not distorted, but as you move farther away from the tangent parallel, the more distorted the map will become. Also, UTM projection is conformal projection, so it is okay to use for population density in a small area because it maintains shape and angles, but the area should also be maintained in that small area.
-
Just some good music! -


My Dog!!