
- The projection that we choose for the BC_Census_Data is the NAD 1983 BC Environment Albers projected coordinate system. This is the projection we want to use because it allows BC to not become distorted in shape and it is a conic projection with secant lines on Canada. In the simply analytics data it was in the projection WGS 1984 which is a conformal projection that doesn’t preserve the compression of BC and Canada.
- Underestimate
- The reason that Stats Canada changed their definition from the old Rural/Urban to the Population Centre and Rural Area classification method is that the term ‘urban’ is widely used and can be interpreted in different ways based on different views. With the old model, any area that had more than 1000 people were considered urban. This method doesn’t differentiate between bigger urban areas and smaller urban areas. So the term ‘urban’ can be misrepresented in the older model.
- The Select by Attribute tool lets us use SQL (Structured Query Language) to define expressions for querying vector data.
- What measurement scale would population density attribute be on?Ratio
- What best describes the Population Center and Rural Area Classification attribute we created? Qualitative data
- Box plots are most useful for looking at frequency distributions. False
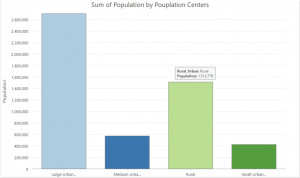
- In which Population Centre and Rural Area class does the largest proportion of BC’s population live? Large Urban Population Centre
- 29
- 17.5
- In the scatter plot I noticed there were a lot of floating points that are different colors which made zero to no sense. Also the r2 score is 0 on the scatter plot which doesn’t indicate a relationship. However, when we classify the data we can see patterns emerging like in the box plot, I noticed that most median average on percent of income spent on food was around 16-17. There were a few outliers in the rural areas where percent of income spent on food was quite high but the median remains roughly the same. I also noticed that medium urban population centers had a way smaller median than the others. This might be because the data set of the medium needs to be bigger to give an accurate example. Since rural area accounts for so much of BC, outliers are expected to occur on the box plot. In some places, the people are self-sufficient and grow their crops, so they spend less money, or in some cases, they import food, and the cost goes up due to travel costs.
-
-

-
Just some good music! -


My Dog!!