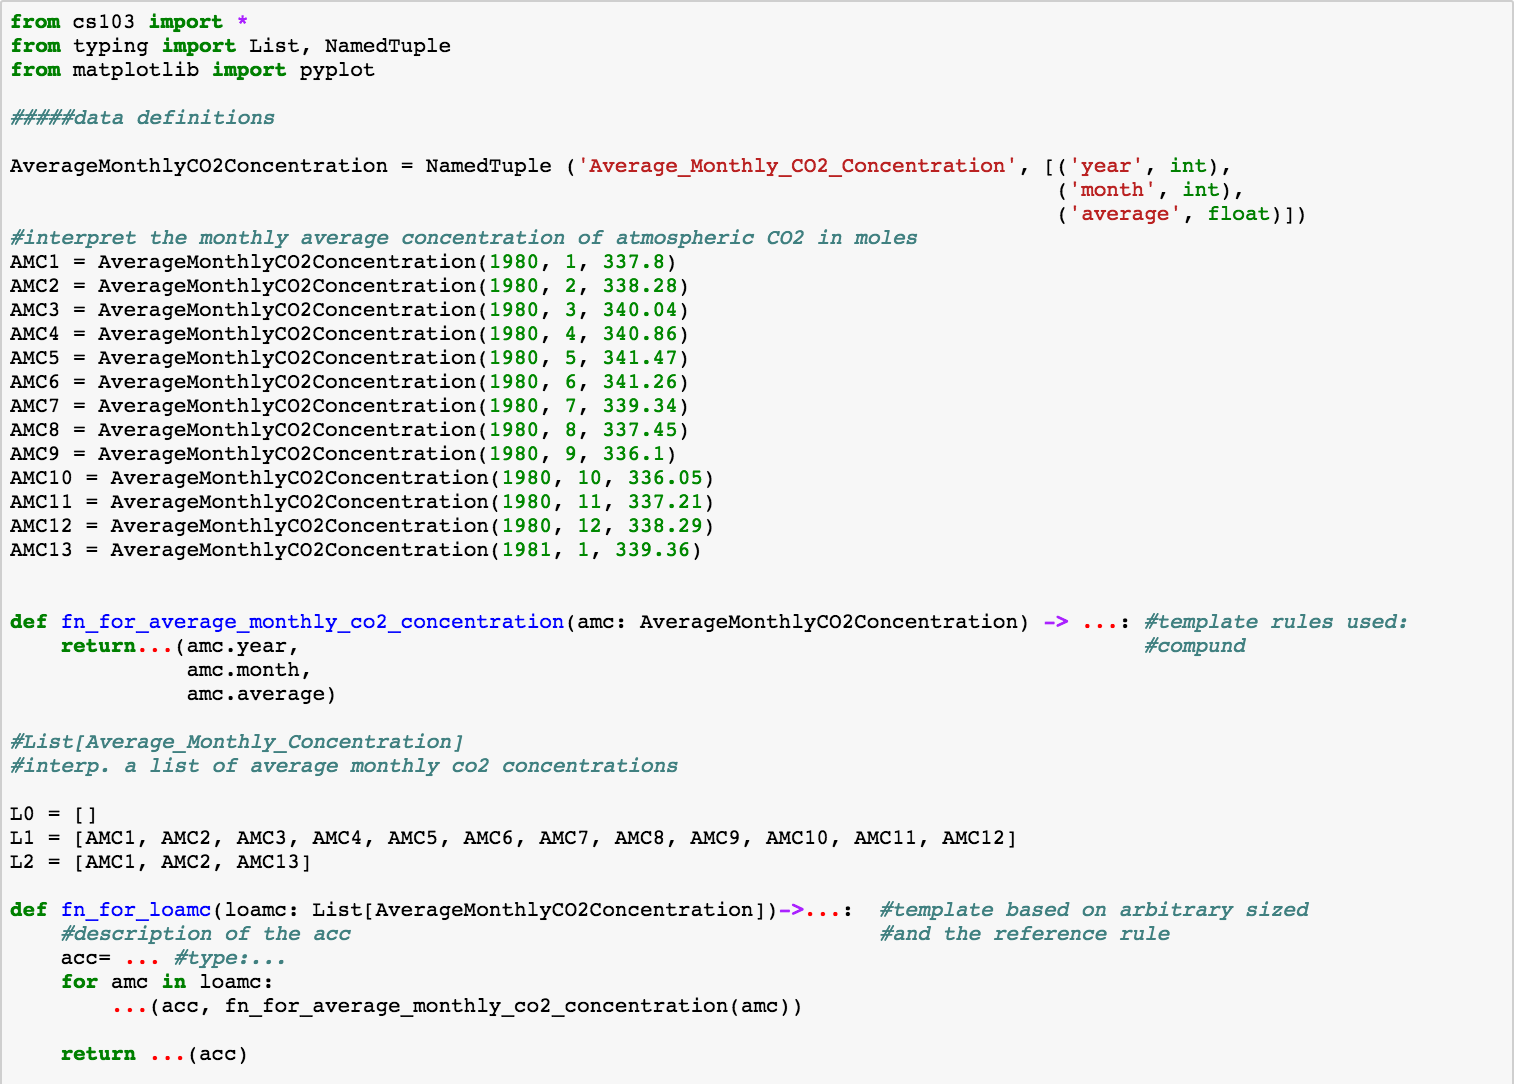
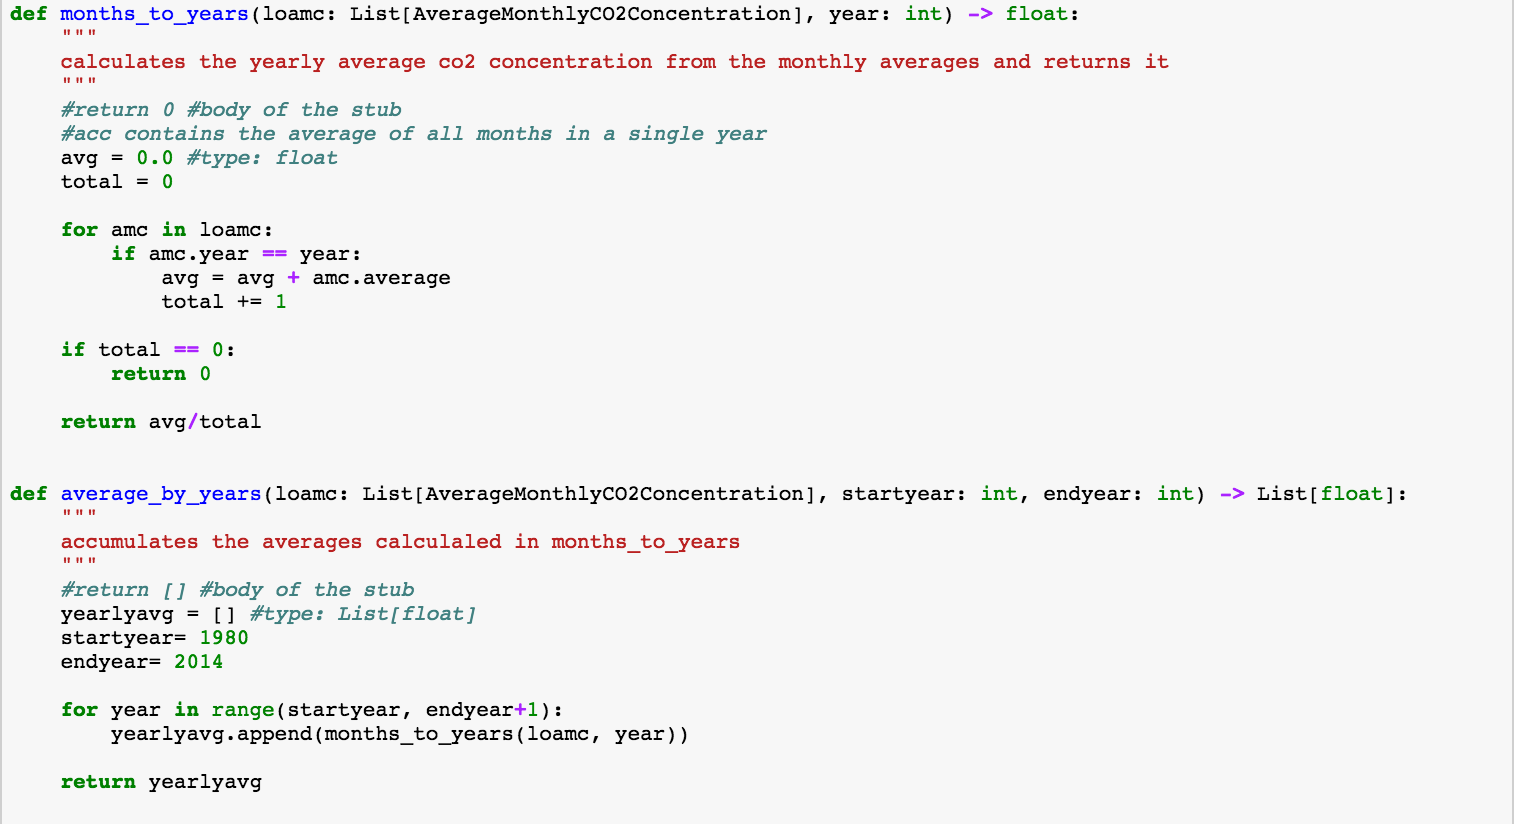
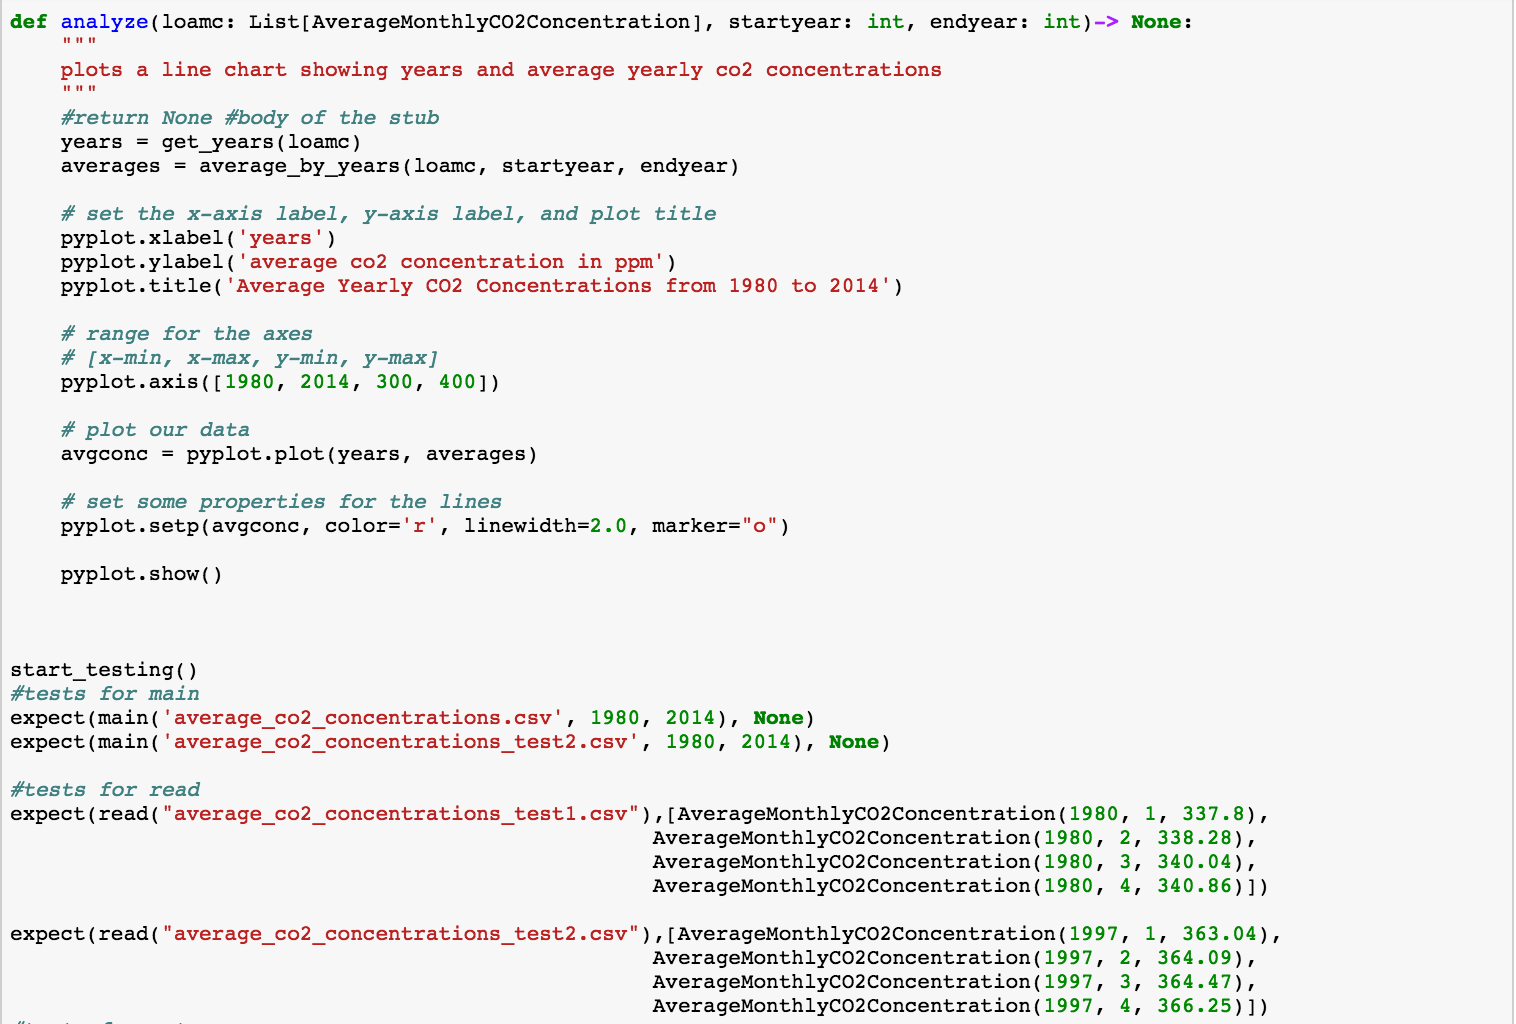
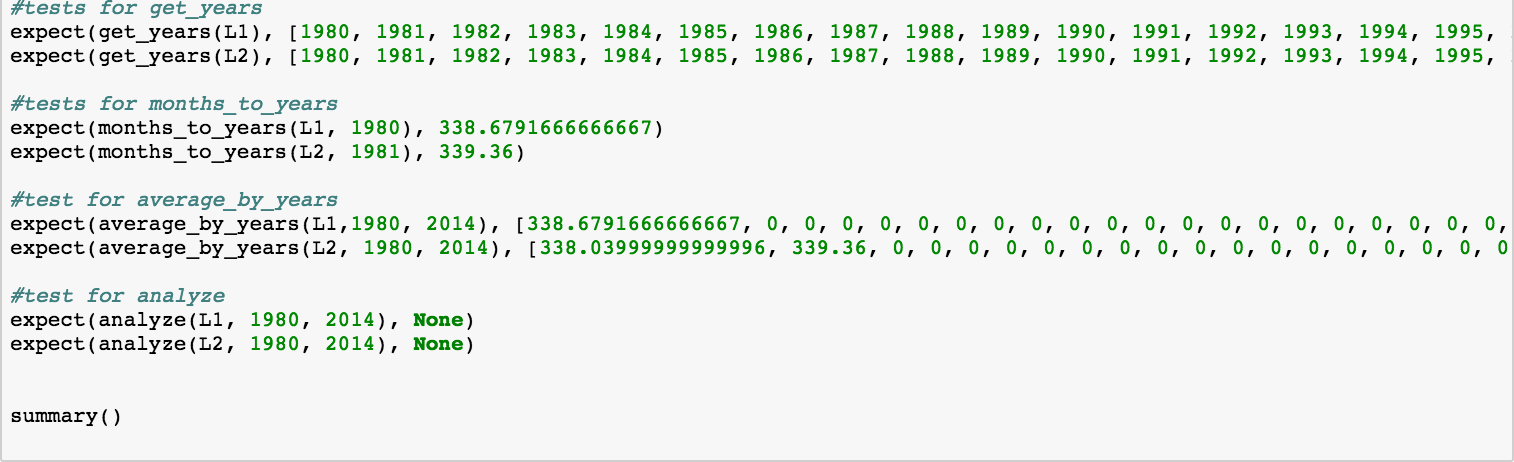
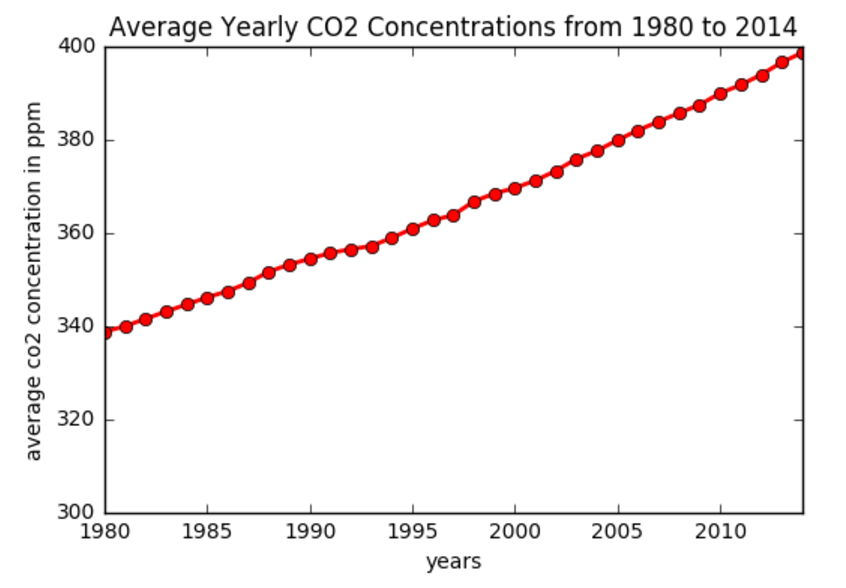
This was my final project for Computer Science 103. I took a file containing information on monthly atmospheric CO2 concentrations in ppm from ~1950 – 2015, and cut it down to work with averages from 1980-2014. I then created this code that calculates and accumulates the yearly averages for those years, and creates a line chart showing the CO2 concentration increase over a period of 34 years. I’m very interested in climate change and the effects of anthropogenic CO2 emissions on our environment, so I wanted to chose an information source for my project that reflected my personal interests. During this term I was also enrolled in an Earth and Ocean Sciences course that focused on long-term climate change, so I found the crossover of content quite appealing.