We were assigned the ashby paper that talked about the effect of miRNA on honeybee caste development. I chose this to be my top 4 because it gave us some ideas to our final project. This paper was based on a just look approach where they analyzed the upregulation and downregulation of miRNA during developement of honeybees and did a bioinformatics analysis, touching on the pathway that miRNA might act on. This paper was initially hard to understand since I was unfamiliar with bioinformatics (umm more like unfamiliar in everything like reading chip or methylation patterns ahaha but this one was harder). It was a good opportunity to introduce myself into the steps of analyzing expression patterns which further developed in my final project.
The worksheet that we have submitted is shown below:
Case study – Stage 1: Analysis and explanation of figures/article worksheet
Assigned article: Ashby et al., 2016
Focus for careful analysis: Table 2, Figure 2 and Figure 5
Questions
1.Your names and surnames:
Shannah Fisher & Joanne Lim
- According to the author what was the overall purpose of the study presented in the paper?
The study investigates differences in the miRNA profiles for the drones, queen and workers during their development (after canalization) and how these differences in miRNA relate to the differences in transcriptional profiles and phenotypic output.
- This article includes a lot of bioinformatic analyses. If you are familiar with at least some of them, feel free to comment in more details; if you are not familiar with them, what are the general system and methods, and the main findings?
Bioinformatic Methods:
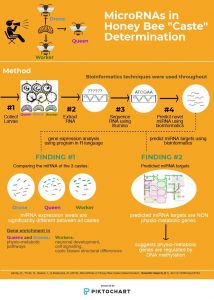
Upon collecting samples from honeybee larvae during stage L5, where commitment to a particular developmental trajectory is irreversible, the researchers extracted their RNA and prepared them illumina sequencing technology. The sequences produced were used in the remainder of the bioinformatics analyses, shown below:
Prediction of novel miRNAs:
- METHOD: This involved inputting the RNA reads (short segments of RNA) from the illumina sequencing output into a software that will output the miRNA’s that are novel. (known miRNAs are found in a database storage miRBase).
- FINDINGS: They were able to identify 82 novel miRNAs in their samples from both intronic and intergenic regions.
Mapping mRNA:
- METHOD: RNA sequencing reads (RNA prediction sequences from illumina) were taken and inputting into a software the aligns the reads to the reference sequence to determine in map the mRNA’s to the bee genome. This will result in the full mRNA sequence of the collected samples.
Differential gene expression analysis:
- METHOD: RNA sequence reads were inputted into a program built in the programming language R that analyzes differential expression of the reads using statistical methods.
- FINDINGS: Of the 164 miRNA’s detected, 120 show differential expression between at least two castes, with 27 showing differential gene expression amongst all three castes.
- FINDINGS: Table 2 findings that compare each caste with each other to determine the changes in miRNA expression levels between castes.
Prediction of miRNA targets:
- Target prediction using the 3’ UTR or for genes lacking 3’UTR, 500bp downstream of the stop codon.
- FINDINGS: The predicted targets found were part of distinct gene pathways, including the steroid hormone pathway, and ion channel formation, to name a few. It was also found that many of the transcripts are targeted by more than one miRNA’s and many of the miRNA’s target more than one gene.
- Carefully consider Table 2 (focus on the high-throughput sequencing side) and the part(s) of the article that talk about the data presented there, then answer the following:What did the author measure/detect/observe?Compared the miRNA expression of the 17 candidates in the 3 different castes during developmental canalization (L4/L5)
- What type of approach do these experiments fall under? Just look experiment in a sophisticated way: quantifying the expression of miRNA without manipulating the system other than extracting miRNA
- What do the data show for workers vs. queens? Expression levels of ame-mir-13b, ame-mir-2, and ame-mir-252a were significantly higher in the queen than workers as shown by a positive fold change greater than 1.5. Expression levels of miRNA’s ame-mir-1175, ame-mir-276, ame-mir-315, ame-mir-375, ame-mir-750 and ame-mir-let7 were significantly lower in that of the queen compared to the worker, as shown by a negative fold change greater than -1.5.Expression levels of ame-bantam, ame-mir-2865-5p, ame-mir-283, ame-mir-2715m, ame-mir-6001-3p, ame-mir-87-1 and ame-mir-87-2 did not show a significant fold change, as indicated by a fold change between -1.5 and 1.5.
- What can we indirectly infer from the data? The miRNAs that showed a significant fold change must be involved in the difference in transcriptional profile and phenotype of workers and queens. These miRNAs may act on the pathways that determine the phenotypic difference of workers and queens.
- What miRNAs may be interesting to study further, and why?
Out of the miRNAs that showed significant fold change, the ones that show higher fold change would be interesting to investigate further. The higher the fold change, the more effect miRNA might have in the differential expression of transcripts and phenotype. For example, by studying the function of a particular miRNA, we might be able to further investigate what pathway is affected by the miRNA to result in differential expression. If we have to pick one, we would study ame-mir-315 because it has the highest fold change (-2.9). Table 4 shows that ame-mir-315 may be involved in targeting pyruvate carboxylase and affect the catalysis of carboxylation of pyruvate to oxaloacetate. With the knowledge that ame-mir-315 expression is highly different in workers and queens, we can infer that the difference in pyruvate carboxylase function contributes to the phenotypic difference of workers and queens
9. Carefully consider Figure 2 and answer the following questions: What type of approach does this experiment fall under?
A sophisticated just look experiment: looking at any correlations and patterns between the three castes in their miRNA and mRNA profiles by grouping the complex profiles together via the Principle Component Analysis (statistical technique).
10. What can we directly conclude from these results?
Haploid drones have different non-coding RNA (miRNA) profile from the diploids at larval stage L4/L5 (developmental stage). mRNA profiles are distinct between the three castes at the larval stage L4/L5 (developmental stage). The difference in mRNA expression profiles in the three castes is more distinct than in the miRNA expression profiles, shown by clustering of samples.
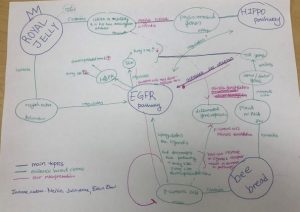
11. Figure 5 summarizes data from the literature and from an analysis for which the direct results are not shown in the main article. What did the author examine, and what do they show in the figure?
The authors examined all of the genes involved in the hippo signaling pathway, which is important in growth and development of the bees. They then categorized the genes into those that differ in expression in the three castes, those that are differentially methylated, and those that are targets of miRNA.
The figure shows:
- which genes are expressed differently in the three castes (pink).
- which genes are methylated in the queen or worker larvae (green) and of those, the differential DNA methylation between the two (green outline).
- the predicted miRNA targets (brown).
12. Overall, how do the data in Table 2 and Figure 2 and 5 support the statement made in the article’s title?
The article’s title is phrased in way that gives caste two meanings. The first meaning implied the true definition of a caste in a bee’s colony where the bees become a queen, worker or drone. The second meaning is traditionally spelt as ‘cast’ and is often used in a play to mean the director casting the actors to their roles. From this, the article’s title suggests that miRNAs are involved in casting the honey bees into their role of worker, drone or queen.
Figure 2 supports this statement by showing that there are overall differences between the miRNA levels of haploid and diploid bees and mRNA levels of all 3 castes. Table 2 then dives deeper by looking at 17 candidate miRNAs and comparing the miRNA expression levels between all 3 castes individually (compare each caste to each other for each miRNA). Figure 5 then shows an example of the differences in miRNA and mRNA levels and their effect on the genes involved in the hippo signaling pathway, one known to play a role in growth and development of the three castes. Overall, this progression of conclusions support the title by showing that the miRNA and mRNA are different overall, in all 3 castes and can cause a phenotypic difference.
Ashby, R., Forêt, S., Searle, I., & Maleszka, R. (2016). MicroRNAs in honey bee caste determination.Scientific Reports, 6(1), 18794. doi:10.1038/srep1879