Category Archives: Small Assignments

Links to entries

DocuLearn 1:https://blogs.ubc.ca/joannebiol463/2018/09/11/doculearn1-my-goals-and-self-regulated-learning/

DocuLearn 2:https://blogs.ubc.ca/joannebiol463/2018/09/20/doculearn2/

DocuLearn 3: https://blogs.ubc.ca/joannebiol463/2018/12/03/doculearn3/

DocuLearn 4: https://blogs.ubc.ca/joannebiol463/2018/12/03/doculearn4/

DocuLearn 5: https://blogs.ubc.ca/joannebiol463/2018/12/03/doculearn-5/

Top 4 Assignments

caste study stage 1: https://blogs.ubc.ca/joannebiol463/2018/12/03/case-study-stage-1/

Lonfat paper: https://blogs.ubc.ca/joannebiol463/2018/12/03/cooperative-assignment-lonfat-et-al/

Wang paper: https://blogs.ubc.ca/joannebiol463/2018/12/04/top4-wang-et-al/

Quiz 4: https://blogs.ubc.ca/joannebiol463/2018/12/04/top4-quiz-4/

Top4: Quiz 4

Joanne (5)

My quiz was on the Hillman et al. paper. I attached my quiz results above. It was an open book quiz asking us to interpret data and give our own opinion about the data and the author’s conclusions. They studied the expression of UBE3A in the CNS and non CNS to see if there is genomic imprinting that regulates the dosage of UBE3A in neurons. I chose this as my top 4 assignment because it was my first time coming up with my own opinion that would go against the authors’ conclusion. The authors had the assumption that imprinting results in a reduced dosage which lead to the conclusion that imprinting doesn’t regulate dosage of UBE3A. However, UBE3A is clearly higher in the CNS than non CNS, so if we think of this case in another way, apart from their assumption, genomic imprinting may be associated with higher level of UBE3A in the CNS.

Below is the worksheet that my friends and I worked on in preparation for the quiz. [there was misformatting when transferring the document such that the numbers are off]

Figure 1: expression of UBE3A in mouse and human CNS (eutherian)

  1. What is FPKM normalization?
    • This stands for fragments per kilobase million from the RNA seq data and it’s a a way of reporting RNA seq results. Normalized here just means that it is per million bases so is is a normalized number rather than being per some other number that is different between RNA seq data (want all data to be reported using same units)
    • Why is there no significance of ube3a in hippocampus in FPKM normalization?
      • There is a significant difference between all samples but just not specifically between hippocampus compared to liver and thymus (but there is a sig diff between hippocampus and heart and lung)
  2. What question is addressed in the experiment?

To test if imprinting in neurons (in the paternal allele) of UBE3A reduces dosage of UBE3A in the neurons compared to other cell types  

  1. Why did the authors have a Ube3am+/p-?
    • To estimate the relative expression levels of the maternal Ube3a allele (to control for the potential effects of the paternal allele on the expression levels)
  2. Justify their choices in technique, control.. Etc.
  3. What could the authors have done for better results?
  4. What do the data show?
  • Higher Ube3a transcript level in the CNS compared to the N-CNS in both Ube3a m+/p+ and Ube3aM+/p-
  • a) Ube3a has significantly higher transcript levels in the CNS (cortex, hippocampus) compared to other cells (heart, kidney, etc) in both Ube3a m+/p+ and Ube3aM+/p-
  • b) Ube3a has significantly higher protein levels in the CNS (cortex, hippocampus) compared to other cells (heart, kidney, etc) in both Ube3a m+/p+ and Ube3aM+/p-
  • c) There is no significant difference between the CNS of Ube3a m+/p+ and Ube3aM+/p- in both the protein and transcript expression
  1. What can we directly conclude from the data?
    • Functional WT paternal Ube3a allele is not necessary to have WT levels of Ube3a transcript in both the CNS and N-CNS tissues (fig 1a)
    • Though hippocampus tissues have a large 5 fold difference between maternal allele and paternal allele transcript abundance, its overall Ube3a transcript count is comparable to other tissues, like the thymus, heart, and liver.
  2. In one sentence, what did the authors demonstrate?
    • CNS transcript abundance of Ube3a in human and mice are similar to many Non-CNS tissues and the maternal Ube3a allele produces the bulk of the transcript product in  CNS.
  3. Are these results what you would expect? Why?
    • In some ways yes and in some no. I would expect to see equal or lower expression levels of Ube3a in CNS compared to N-CNS since in the CNS, Ube3a is imprinted and therefore there is only expression coming from the maternal allele, however, we observe that Ube3a is expressed in higher amounts in the CNS compared to N-CNS. This suggests that Ube3a is being overexpressed in the maternal allele or there is some sort of regulatory mechanism happening when the paternal allele is expressed. Other results are expected.


Figure 2: Maternal Ube3a compensates for loss of paternal Ube3a expression during neurogenesis

  1. What experiments did they do? What are the controls and why did they have that?

a)Immunofluorescence imaging of prenatal primary neurospheres

Maybe no control:  they compared the pattern in paternal and maternal Ube3a

  1. b) western blot to show the difference in YFP and normal protein
  2. d) measured intensity values  
  1. What was the purpose of these experiments? What question were they addressing?
  • This was to show that imprint is acquired during neuronal differentiation and there is bias toward maternal allelic expression of Ube3a in the days post differentiation
  • Question addressed: does the maternal allele shift expression in a compensatory way for the paternal decreased expression?
  1. What do the data show?
  1. d) intensity of maternal UBe3a increases significantly at 16DPD. Paternal decreases in a linear manner from DPD1 to DPD16. There seems to be an inverse relationship between the maternal and paternal Ube3a in the primary neurons
  2. e) At DPD1, the difference in intensity of Ube3a is not significant. As DPD increases, the discrepancy between maternal and paternal protein intensity increases.
  1. What can we conclude from the data?

There seems to be an inverse relationship between the maternal and paternal Ube3a in the primary neurons. Intensity of maternal protein increases while that of paternal protein decreases.  

  1. What can we not conclude?

Whether or not the decrease in paternal protein intensity CAUSES increase in maternal intensity

  1. What can we infer from the data?

Imprinting of ube3a at the paternal allele is initiated upon neuronal differentiation. Increase in Ube3a from the maternal allele compensates for loss of expression of the paternal allele in neurons.

Figure 3: Ube3a protein levels are higher in mouse and opossum despite no imprinting in opossum


  1. What does the several SNV mean?
  1. Single nucleotide variant
  1. What experiments did they do? What are the controls and why did they have that?


  1. What was the purpose of these experiments? What question were they addressing?
  2. What do the data show?
  1. The alleleic ratio of maternal and paternal in UBE3A (opossum) are similar in the SNVs of the cortex. However, the number for paternal is slightly higher in SNV4 than maternal though not statistically significant.
  2. Expression of UBE3A in CNS is significantly higher than in N-CNS
  1. What can we conclude from the data?
  1. UBE3A is biallelically expressed in the opossum
  2. Imprinting is NOT NECESSARY to result in high UBE3A expression in CNS compared to N-CNS
  1. What can we not conclude?
  1. What can we say about slightly higher ratio in paternal?
  2. If imprinting is not the cause for higher UBE3a expression in imprinted mouse  
  1. What can we infer from the data?
  1. b) There are other mechanisms that induce expression of mouse UBE3A particularly in the CNS compared to N-CNS
  1.     C) imprinting in the mouse may cause higher expression of Ube3a in the cortex compared to expression of UBE3A in opossum.

DocuLearn 5

Questions

  1. Please review your DocuLearn 1 to remind yourself of the two “things” that you wanted to learn in the course. Did you learn them (to the level that you were expecting)? If not in this course, did you learn them in a different course or context this term?


      • Through this course, I became more familiar with reading review articles and research papers to gain more knowledge in gene regulation processes. I learned that searching for more articles and skimming the abstract and introduction helps to gain understanding that may not have been provided by one article. My expectations were met.
      • I also learned to ask questions that will help me gain more understanding of the system of study. For example: what do the data show, what can I conclude, what can I infer, can I think of a way to explain the results? My expectations were met for this one as well.


2. Recall the idea saying that self-regulated learning involves:

      • attending to key features of the environment
      • resisting distractions
      • persisting when tasks are difficult
      • responding strategically, flexibly adaptively.

Were there situations in the course when you feel that you really demonstrated each of these behaviours (and what were the situations)?

      • Resisting distractions: One of the biggest challenge while working on the final project was spending too much time reading articles that may not be important. It would be great if I could figure that out early on, but for this occasion, it was a good opportunity to get exposed to any related topics.
      • Persisting when tasks are difficult: I think I would say I accomplished this if I successfully hand in my project. Also sought for help when we felt like we were stuck.
      • Responding strategically, flexibly and adaptively: I’m not sure what to say about this point. We have spent so much time on the draft and it’s still not finished. If I have time, I would like to ask my peers of what they thought about this point. What other instances might there be that I am overlooking?
  1. Overall, what was the most challenging thing in the course for you? How did you handle this challenge?
      • Learning from other people’s perspectives and speculations. Initially, I had a hard time following through people’s ideas. I think later on I started to understand better of what classmates are discussing. Sometimes writing down the discussion word for word then looking back at it helped. I think another factor that helped was having a better understanding of what is going on in the system that we are talking about.
      • Another challenge: time management! I can’t say that I overcame this challenge. I think I could have been more active in discussions if I did the reading beforehand. I thought I was pretty fine with time management, but I’m not sure what to say in the context of this course. I think I’ll have a better thought after completing the final project…  I think the problem is that I spend too much time on unnecessary things? Or not? I will get back to this part if I have time.

From <https://canvas.ubc.ca/courses/9305/assignments/261593>

DocuLearn4

Questions

    1. Over the past couple of weeks you have likely spent a noticeable amount of time working on your final project. What has been the most challenging aspect, and what helped you overcome this challenge? (You may think of things that you did, strategies that you employed, or tools and resources that you used).
      • Time management
        • I think a challenge that I faced over the weekend was the underestimation of the amount of time that would be required to complete the project draft. Because we had our outline completed, and we had been taking notes of the information that we would want to use on our draft, I thought a day would be sufficient. It took more time to synthesize of information from here and there and to write about them so that they flow well. We were able to complete our project by the extended deadline. For next time, I should allocate more time in writing the background and introduction section – or complete writing it before hand, while I am searching for information.
        • I think we were pretty good at continuously working on the project over the term. Shannah and I met once a week to discuss about our progress and the direction that we would want to go towards.
      • Being on track
        • I think I also spent a lot of time reading articles that were not super necessary for the progress of the project. I was able to later realize that I wouldn’t have to spend so much on such a topic, but the time to get to that realization was long. I hope I can develop a better skill for that. I’m not sure how – by experience?
    2. So far, what do you feel that you have learned (or, what skills have you improved) as a result of working on your project? Is this something that you expected? Have there been any surprises?
      • Reading papers
        • In the beginning, it took a long time to understand what the article was talking about, and what information would be useful for my project. Later on, as I got more familiar with the terms as well as an idea of what the general outline of the project would be, I became faster in gathering information (yet I would still sometimes get off track…).
        • Learning from research articles was one of the challenges that I listed in the beginning of the term. Through this experience, I learned that when I can’t understand the concept by reading one article, I could look into another article related to the topic. One article would have the details not provided in the other. Also, going into the referenced article also helped gain more information and understand what was going on.

DocuLearn3

      1. You have now spent almost two weeks tackling the issue of caste differentiation in honeybees. Is there anything that you learned throughout this ‘unit’, which you had not learned before? If so, briefly describe it; if there is nothing new, it is OK to say so.
        • I feel like everything was pretty new for me content wise with my case study paper, which is on the effect of miRNA on honey bee caste determination. One of the novel things that I encountered was learning how to describe a “just look experiment”. I had a formula in my mind that if it’s an adding experiment, then I would conclude that whatever is added is “sufficient to result in” something. If it’s a knock out experiment, then I would conclude that whatever that was knocked out is “necessary to result in” something. We were able to describe the data as well as what we can infer from the data by extensively looking back and forth of the explanation provided in the paper and the data. I’m not sure if I would have been able to come to the same answers without the help of the text. I think it might something that I should try to work on in order to prepare for the midterm.
        • Other things that I have learned: how a bioinformatics project of this kind is done (examining differential expression to figure out which miRNA might be important in caste determination, predicting what function they might have, and etc.) and that there are many different kinds of bioinformatics in biology. It was fun to have a discussion with my lab partner Shannah about what I know about bioinformatics (finding the function of  a gene) and what she knows about bioinformatics (related to computational biology and phylogenetics).
      2. What skills do you find that *you* have been using/practicing so far in this unit? Outside this unit and this class, do you think they may be useful skills to have
        • Skill: reflecting on what I didn’t do well in the past and improving for the next one
        • I received feedback on quiz 2 that I should include numbers and amounts when I describe the data. I practiced to incorporate numbers when doing the stage 1 assignment, and I was happy to receive a positive feedback about it! I think this skill is very important not only in academics but in life in general – to learn from mistakes 🙂
        • Skill: practicing presenting my ideas and trying to understand what others say

3. Thinking about challenges throughout this unit, do you find that they are similar to those you described in your previous DocuLearn assignment, or similar to the ones you were anticipating in your first DocuLearn assignment

  •  Summary of challenges: (1) reading journals and review articles (2) asking effective/ scientific questions to improve my understanding on the topic (3) following through the lecture material and extracting (?) information that is useful during discussion
  • (1) I think this is a less of a challenge than I anticipated! The honeybee paper was not as challenging as I thought it would be after having read through it a couple of times. Discussing with my partner and asking/answering questions to each other helped us fill in the gaps to understand the paper.
  • (2) I think this is still might be a challenge, but I am glad to have gotten more practice on this
  • (3) The integrative summary was a good practice for this. I think it still is a challenge.


Honeybee model

After finishing the infographics, we formed new groups consisting of at least one person from each paper. We integrated the information provided by each paper to develop a model for how the different caste phenotypes develop. We separated parts that were explicitly given from the papers and parts that we made inferences to connect different ideas.

Top4: Lonfat et al.

[There was misformatting in while transferring the document, so the numbers are mixed ]

This is one of my top 4 assignments because the lonfat paper was the hardest paper in this class in that they had multiple techniques and had a complex way of studying gene interaction. I initially had no idea what they were doing with the inversions and what they were trying to say in the paper. After having discussions in class, it became clearer that the inversion would change the position of the genes, and therefore would allow us to study whether or not the position of enhancer affects gene expression. From this paper, I learned how to read the bisulfite sequencing paper, and how to think about different data (staining, bisulfite sequencing, experimental system, and chip) can come to one interpretation. It was interesting to learn that enhancers can be position dependent in some cases.

In-class small assignment: Lonfat et al. paper

Assigned paper: Lonfat, N., Montavon, T., Jebb, D., Tschopp, P., Nguyen Huynh, T.H., Zakany, J., Duboule, D. (2013). Transgene- and locus-dependent imprinting reveals allele-specific chromosome conformations.


Supporting PDF: http://www.pnas.org/content/pnas/suppl/2013/06/30/1310704110.DCSupplemental/pnas.201310704SI.pdf


Names of your group members:

Shannah Fisher, Joanne Lim, Erin Yang


Question 1

It is quite common for research papers to have Figure 1 be the “most important” figure in the article. Consider Figure 1:


  • What transgenic lines did the author use? Please briefly describe them (do these lines look somewhat familiar)?


The transgenic lines used were Hox9lacZ transgene inserted into the HoxD gene in both the forward direction and with an inversion in the region starting from ex26 to the end of Hoxd9lacZ insertion (contains ex26, Pdk1, digit enhancer sequences and the Hoxd9lacZ insertion).

(HoxD9lacZ transgene was inserted upstream of the HoxD gene. One transgenic line had HoxD9lacZ closely upstream of HoxD, and the other transgenic line had an inversion at Itga6loxP and rel5loxP such that the transgene is located further away from Hox D.

The transgenic lines shown in the Lonfat et al. paper is similar to that shown in class in that both are designed upstream of HoxD. However, the transgenic line from class includes Evx2 in the inversion.)


  1. What do the data in Panel C show?

In the normal HoxDrel5 embryo’s, there is no difference in expression of lacZ transgene between maternal and paternal inherited transgenes. However, in the inverted HoxDInv(rel5-Itga6) transgene, the embryo’s with paternal inherited transgenes showed higher expression of lacZ insert (compared to HoxDrel5 embryos) and maternally inherited trangenes showed no expression of lacZ.


  1. What is striking/unexpected about the data in Panel C?

When the Hoxd9lacZ inversion is inherited through the paternal line, fetuses show very strong staining from the transgene beyond its typical regions whereas the identical transgene inherited through the maternal almost entirely lacks staining. This suggests a very efficient regulatory mechanism that exists as separate inheritable paternal and maternal patterning.


  1. What direct conclusions do you make from the data?

Inversion of the region is sufficient to increase the expression of lacZ in the embryo with paternal inherited transgene as well as decrease expression of lacZ in maternal inherited transgenic embryos.


Question 2

How did the authors show that the peculiar effect observed is specific and position/site-specific?

  • The authors first inserted the lacZ transgene in the HoxDrel5 (rel5) site and observed no bias in expression based on parental inheritance.
  • After inverting the region using the loxP sites in rel5 and exon 5 of Itga6, they observed that the lacZ transgene was now biased in expression depending on which parent the transgene was inherited from.
  • The translocation results suggest regulatory effects influenced by parental inheritance that differ between Itga6 site and the rel5 site.
  • The authors showed that the result is transgene specific because the same effect was not observed when tested with SB lacZ.


Do you agree with their data interpretation and with their conclusion?

  • Yes, in the case of the lacZ transgene it seems that the effects are site specific. But the in vitro relevance of this data needs further development as a Hoxd11 inversion without the lacZ transgene didn’t produce the same bias in expression.


Question 3

Consider Figure 2 (please don’t hesitate to ask for clarification if you and your group have questions about it!):

  1. Briefly explain how to “read” the diagrams shown (i.e. what do the rows of circles represent, what do the white vs. black circles represent).
  • The white dots represent unmethylated regions, and the black dots represent methylated regions. Each dots represent DNA regions.
  1. What do the data in Figure 2 show?
  1. Embryos that paternally inherited transgenic line HoxDInv(rel5-Itga6) showed very low levels of methylation of DNA from E12.5 presumptive digits while those that maternally inherited HoxDInv(rel5-Itga6) showed extremly high methylation of DNA.
  2. The escapers showed varying methylation patterns.
  3. DNA from oocyte with the inverted allele is highly methylated while from the sperm isn’t. This suggests that the methylation patterns are carried through the oocyte and to maternally inherited offspring.
  4. Methylation patterns are not different in embryos that inherited rel5.
  1. Why aren’t there a “paternal/+” and a “maternal/+” groups for sperm and oocytes?

Sperm and oocytes are haploid gametes, each containing one allele. There is no paternal or maternal allele in the gametes.

  1. What are “escaper” embryos, and how were they identified prior to bisulphite sequencing?

Escaper embryos are maternal transgenic embryos that expressed variable levels of lacZ unlike other maternal inherited embryos that had no expression. These embryos expressed it despite the allele being silenced through maternal imprinting, thus “escaping” silencing. Expression of lacZ was studied through in situ hybridization and lacZ staining.

  1. What can we directly conclude from the data?

High levels of DNA methylation is inherited through the oocyte germline. Inversion in the transgenic line is sufficient to result in extremely different methylation patterns with paternal/sperm DNA having low DNA methylation while maternal/oocyte having high DNA methylation.


Question 4

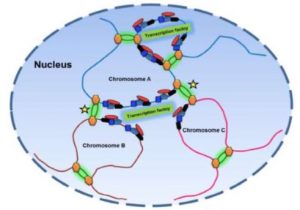
Figure 3 depicts the results of a series of 4C experiments. Try to “read” the figure and see if you can identify the information described in the text.

  1. What did the authors do, and what are the results?

They use the lacZ sequence as bait for 4C experiments in normal HoxD-rel15 and inverted HoxDInv(rel-15-Itga6) for both paternal and maternal inherited transgenes.

Before inversion, there is no difference in interactions between lacZ and enhancer regions between the paternal and maternal inherited trangenes. However, after inversion, the paternal and maternal inherited transgenes, show a difference in interactions between enhancers and lacZ.The authors discuss that only the paternal allele interacts with the transgene and the digits enhancers, suggesting further effects on regulatory interactions based on the parental imprint.

  1. What can be directly concluded from the data?

The inversion of the  rel5-Itga6 region is sufficient to change the interactions between lacZ with maternal and paternal inherited transgenes.


Question 5

How does each figure support the statement in the title of the article? Which one supports it most?

Transgene dependent vs locus dependent imprinting → allele specific chromosome conformation


Figure 1 & 2: shows that maternal imprinting is dependent on the inversion, which brings the Hoxd9lacZ closer to Itga6. They showed transgene dependent imprinting by doing the same experiment with different transgenes.


Figure 3: reveals allele-specific chromosomal conformation by showing 3D conformation through 4C experiment, so this is figure supports the title the most.


Top4: Case study stage 1

We were assigned the ashby paper that talked about the effect of miRNA on honeybee caste development. I chose this to be my top 4 because it gave us some ideas to our final project. This paper was based on a just look approach where they analyzed the upregulation and downregulation of miRNA during developement of honeybees and did a bioinformatics analysis, touching on the pathway that miRNA might act on. This paper was initially hard to understand since I was unfamiliar with bioinformatics (umm more like unfamiliar in everything like reading chip or methylation patterns ahaha but this one was harder). It was a good opportunity to introduce myself into the steps of analyzing expression patterns which further developed in my final project.

The worksheet that we have submitted is shown below:

Case study – Stage 1: Analysis and explanation of figures/article worksheet

Assigned article: Ashby et al., 2016

Focus for careful analysis: Table 2, Figure 2 and Figure 5

Questions

1.Your names and surnames:

Shannah Fisher & Joanne Lim

  1.  According to the author what was the overall purpose of the study presented in the paper?

The study investigates differences in the miRNA profiles for the drones, queen and workers during their development (after canalization) and how these differences in miRNA relate to the differences in transcriptional profiles and phenotypic output.


  1. This article includes a lot of bioinformatic analyses. If you are familiar with at least some of them, feel free to comment in more details; if you are not familiar with them, what are the general system and methods, and the main findings?


Bioinformatic Methods:

Upon collecting samples from honeybee larvae during stage L5, where commitment to a particular developmental trajectory is irreversible, the researchers extracted their RNA and prepared them illumina sequencing technology. The sequences produced were used in the remainder of the bioinformatics analyses, shown below:

Prediction of novel miRNAs:

  • METHOD: This involved inputting the RNA reads (short segments of RNA) from the illumina sequencing output into a software that will output the miRNA’s that are novel. (known miRNAs are found in a database storage  miRBase).
  • FINDINGS: They were able to identify 82 novel miRNAs in their samples from both intronic and intergenic regions.

Mapping mRNA:

  • METHOD: RNA sequencing reads (RNA prediction sequences from illumina) were taken and inputting into a software the aligns the reads to the reference sequence to determine in map the mRNA’s to the bee genome. This will result in the full mRNA sequence of the collected samples.

Differential gene expression analysis:

  • METHOD: RNA sequence reads were inputted into a program built in the programming language R that analyzes differential expression of the reads using statistical methods.
  • FINDINGS: Of the 164 miRNA’s detected, 120 show differential expression between at least two castes, with 27 showing differential gene expression amongst all three castes.
  • FINDINGS: Table 2 findings that compare each caste with each other to determine the changes in miRNA expression levels between castes.

Prediction of miRNA targets:

  • Target prediction using the 3’ UTR or for genes lacking 3’UTR, 500bp downstream of the stop codon.
  • FINDINGS: The predicted targets found were part of distinct gene pathways, including the steroid hormone pathway, and ion channel formation, to name a few. It was also found that many of the transcripts are targeted by more than one miRNA’s and many of the miRNA’s target more than one gene.


  1.       Carefully consider Table 2 (focus on the high-throughput sequencing side) and the part(s) of the article that talk about the data presented there, then answer the following:What did the author measure/detect/observe?Compared the miRNA expression of the 17 candidates in the 3 different castes during developmental canalization (L4/L5)
  2. What type of approach do these experiments fall under? Just look experiment in a sophisticated way: quantifying the expression of miRNA without manipulating the system other than extracting miRNA
  3. What do the data show for workers vs. queens? Expression levels of  ame-mir-13b, ame-mir-2, and ame-mir-252a were significantly higher in the queen than workers as shown by a positive fold change greater than 1.5. Expression levels of miRNA’s ame-mir-1175, ame-mir-276, ame-mir-315, ame-mir-375, ame-mir-750 and ame-mir-let7 were significantly lower in that of the queen compared to the worker, as shown by a negative fold change greater than -1.5.Expression levels of ame-bantam, ame-mir-2865-5p, ame-mir-283, ame-mir-2715m, ame-mir-6001-3p, ame-mir-87-1 and ame-mir-87-2 did not show a significant fold change, as indicated by a fold change between -1.5 and 1.5.
  4.    What can we indirectly infer from the data? The miRNAs that showed a significant fold change must be involved in the difference in transcriptional profile and phenotype of workers and queens. These miRNAs may act on the pathways that determine the phenotypic difference of workers and queens.
  5. What miRNAs may be interesting to study further, and why?

Out of the miRNAs that showed significant fold change, the ones that show higher fold change would be interesting to investigate further. The higher the fold change, the more effect miRNA might have in the differential expression of transcripts and phenotype. For example, by studying the function of a particular miRNA, we might be able to further investigate what pathway is affected by the miRNA to result in differential expression. If we have to pick one, we would study ame-mir-315 because it has the highest fold change (-2.9). Table 4 shows that ame-mir-315 may be involved in targeting pyruvate carboxylase and affect the catalysis of carboxylation of pyruvate to oxaloacetate. With the knowledge that ame-mir-315 expression is highly different in workers and queens, we can infer that the difference in pyruvate carboxylase function contributes to the phenotypic difference of workers and queens

9.     Carefully consider Figure 2 and answer the following questions: What type of approach does this experiment fall under?

A sophisticated just look experiment: looking at any correlations and patterns between the three castes in their miRNA and mRNA profiles by grouping the complex profiles together via the Principle Component Analysis (statistical technique).

10.  What can we directly conclude from these results?

Haploid drones have different non-coding RNA (miRNA) profile from the diploids at larval stage L4/L5 (developmental stage). mRNA profiles are distinct between the three castes at the larval stage L4/L5 (developmental stage). The difference in mRNA expression profiles in the three castes is more distinct than in the miRNA expression profiles, shown by clustering of samples.

11.  Figure 5 summarizes data from the literature and from an analysis for which the direct results are not shown in the main article. What did the author examine, and what do they show in the figure?

The authors examined all of the genes involved in the hippo signaling pathway, which is important in growth and development of the bees. They then categorized the genes into those that differ in expression in the three castes, those that are differentially methylated, and those that are targets of miRNA.

The figure shows:

  • which genes are expressed differently in the three castes (pink).
  • which genes are methylated in the queen or worker larvae (green) and of those, the differential DNA methylation between the two (green outline).
  • the predicted miRNA targets (brown).

12.  Overall, how do the data in Table 2 and Figure 2 and 5 support the statement made in the article’s title?

The article’s title is phrased in way that gives caste two meanings. The first meaning implied the true definition of a caste in a bee’s colony where the bees become a queen, worker or drone. The second meaning is traditionally spelt as ‘cast’ and is often used in a play to mean the director casting the actors to their roles. From this, the article’s title suggests that miRNAs are involved in casting the honey bees into their role of worker, drone or queen.

Figure 2 supports this statement by showing that there are overall differences between the miRNA levels of haploid and diploid bees and mRNA levels of all 3 castes. Table 2 then dives deeper by looking at 17 candidate miRNAs and comparing the miRNA expression levels between all 3 castes individually (compare each caste to each other for each miRNA). Figure 5 then shows an example of the differences in miRNA and mRNA levels and their effect on the genes involved in the hippo signaling pathway, one known to play a role in growth and development of the three castes. Overall, this progression of conclusions support the title by showing that the miRNA and mRNA are different overall, in all 3 castes and can cause a phenotypic difference.

Ashby, R., Forêt, S., Searle, I., & Maleszka, R. (2016). MicroRNAs in honey bee caste determination.Scientific Reports, 6(1), 18794. doi:10.1038/srep1879


DocuLearn2

Daniel et al., 2014

  1. What are two things that you learned in the first few weeks of the course? Please give a brief description of them (~one sentence).
    • I Learned how to interpret and communicate the data that is presented. I wasn’t clearly aware of the difference between explaining what the data shows, direct conclusions from the data, and interpretations. I think I still need to work more on making the clear distinctions as well as presenting my thoughts more clearly.
    • I learned that enhancers do not necessarily have to be on the same chromosome of the gene that it acts on. I learned about enhancers this summer as a cis- regulatory element. It’s interesting how as we go into upper years, we learn that what we have learned in lower year classes are sometimes not entirely correct.

2. Do any of the two things described under Q1 fit in with/relate to what you said you wanted to learn in your DocuLearn 1? If so, how do they fit in?

  • My two goals from DocuLearn 1 were: (1)  learning based on literature reviews and articles (2) developing scientific questions.
  • I think learning how to interpret data relates to my second goal in being able to develop scientific questions. The process of data interpretation entails asking questions to myself: what do the data show, what direct conclusions can I make, how can I explain this result etc. Then, I might shift from just focusing the data presented to looking at the bigger picture and the mechanisms involved. With practice, I should be able to come up with scientific questions at the bigger picture level.

3.  So far, what has been the most challenging aspect of the course, if any? What about the most surprising/unexpected, if any?

  • It’s really cool how students bring in ideas and information about experimental techniques. However, I found it hard to follow through all the ideas discussed in class – especially when some of them are not the preferable answers to the discussion questions but also not entirely wrong. I’m not sure if I was able to make clear notes on what part is applicable/ correct and what part isn’t.

DocuLearn1: My goals and self-regulated learning

  1. What are two “things” that you would like to learn in this course? Please try to be specific, so that you can then track your progress towards this learning goal.
  • I am excited and also a little worried about learning based on journals and review articles than textbook only since I am used to using the textbook as my main reference. I would like to learn how to efficiently find the relevant information I need and how to recognize that I am spending too much time on information that is not important in the big picture.
  • I would like to learn and practice how to come up with effective questions. This includes questions that would help me learn the course material in gene regulation and scientific research questions. In order to come up with scientific research questions, I think I would have to develop having an inquisitive mindset and understand the course material.
  • (I would also have to develop myself in effectively communicating my ideas and thoughts)

2. In class you were briefly introduced to the concept of self-regulated learning and its relevance in learning (broadly) and in research. We also stated that it involves four elements:

  • attending to key features of the environment
  • resisting distractions
  • persisting when tasks are difficult
  • responding strategically, flexibly adaptively.

Select one of the two “things” that you listed in Question 1, explain which of the four elements above you anticipate being the most challenging for you in this context, and describe what you will do to respond to the challenge

  • Responding strategically, flexibly, and adaptively would be the most challenging element in the context of my first learning goal. I struggled in my bioinformatics project in BIOL 341 because I couldn’t find information related to the direction I was interested in going into. Instead of responding strategically, I spent more time trying to find information that did not exist or was not available. This resulted in an unsatisfactory level of time management for the project. In order to respond to this challenge, I would reflect on myself as I work on an assignment or project whether or not I am spending too much time on something without a positive result. Then, I would reflect on whether or not I am on the right track with my work and think if there is another way to approach the task. I should also ask for help when I am struggling rather than continue on working on the same thing hoping that I will get a positive result after I spend more time on it.
  1. Do you think that what you just did (answering Q1 and Q2) is part of self-regulated learning, or is it something else?
  • I think it is part of self-regulated learning. The questions required me to reflect on myself and identify times when I  had challenges and how those challenges relate to the elements of self-regulated learning. Also, all of these processes required resisting to distractions in order to complete.