Rethinking how local communities affect surrounding mangroves: Executive summary
Introduction
Mangroves play an important role in their ecosystem due to the ecological benefits they provide (Buelow and Sheaves 2015). A Provisioning service provided by mangroves include supporting fish and other sea life biodiversity for fishermen (Quimby 2015). They provide regulating services such as increasing overall coast protection from storm surges and erosion (Rahdarian et al. 2017). They also provide cultural services such as they provide a place for fisherman to fish (Quimby 2015).
The questions arise to whether communities affect mangrove loss due to human interactions. Our group decided to choose the Ambanja-Ambaro Bay of Northwest Madagascar, Africa, presented on Figure 4. Data was provided by Dr Trevor Gareth Jones of the University of British Columbia, faculty of forestry. Population data for per-capita analysis were retrieved from the Humanitarian Data Exchange. To examine if local communities might play a role in mangrove loss, we looked at potential socio-economic drivers and asked if the increase in populations decrease mangrove cover, and if settlements decrease mangrove cover. Then we analyzed overall mangrove cover change and examined if it was significant. After doing research on mangrove loss, we discuss ecological implications that may occur.
Mangrove cover change
Before beginning the analysis of whether communities affect mangrove loss, we examined whether there was any loss in our study area to begin with. We used data mangrove data from Dr Jones from 2000, 2003, 2006, 2008, 2010, 2013, and 2014, and calculated squared kilometer area. Due to unequal time intervals, we used non-parametric calculations to remove bias and normal distribution assumptions. A called Mann-Kendal Trend Analysis and Sen’s Slope was performed.
A graph of mangrove cover over time is shown in Figure 1. Visually there is a loss of mangrove cover in terms of area loss and percent change. Trends analysis computed p-value of 0.002667 which is significant, and a Sen’s slope of -3.46333 which shows a decreasing trend.
Population and mangrove change
Seeing that mangrove cover was decreasing over time, we added population to the equation. The mangrove cover was intersected with the region’s fukontany (province) using ArcMaps. This was done for each year of mangrove cover data and mangrove cover change was calculated for each fukontany. In each fukontany of the study site, mangrove cover and population was compared over time.
In Figure 2. majority of the fukontany that has mangrove cover situated within its boundaries experience cover loss over time. A regression was done comparing changes in mangrove cover and change in population density of each fukontany and there was no relationship (r = 0.01854 / p-Value = 0.326175).
Settlements and mangrove change
Settlement points, from Dr Jones, were placed on the map and given a buffer distance of 2.29km. This distance is the average minimum one-way distance traveled from settlement for local fisherman (Teh et al. 2012). This is based on Quimby (2015) that small-scale fishermen use mangroves for fishing, and assuming people in these settlements near the coast are small-scale fishermen. Area squared kilometer was calculated inside and outside the buffer, and was compared over time. Fragmentation analysis was computed, and a Mann-Kendal Trend analysis and Sen’s Slope was used to analyze the fragmentation trend.
Between 2000 and 2014, areas inside the buffer experienced a 6.17% loss of mangrove cover whereas areas outside experienced 9.89% loss of cover, signifying that settlements may not be the factor leading to mangrove loss. Shown in Figure 3. Number of Patches (NP) significantly increase for both different areas, however areas outside the buffer are experiencing a greater rate of fragmentation. Total Core Area (TCA) decreased for both different areas, however rate of TCA loss is only significant for areas outside the buffer. Percent loss, NP, and TCA calculation show that mangrove cover always from settlements are experiencing most loss and fragmentation.
Study site analysis
An overall analysis of the entire study site was examined to ensure consistency of hypothesis testing and if it matched overall study site trends. Fragmentation analysis, and a hotspot of mangrove loss analysis was done separately. Fragmentation analysis looked at mangrove cover as an entire entity, and mangrove cover loss was calculated and compared to each fukontany to see which areas experienced most loss. Time frame comparison remained the same.
The NP of the study site increased over time and the trend is significant (p= 0.00267). TCA of the study site decreased over time and is also significant (p = 0.00267). This shows study site is experiencing fragmentation and areas fragmented are decreasing. The trend of increasing fragmentation may lead to a decline in fish diversity (Tran et al. 2017). Figure 5. shows that there is a centralize area of mangrove loss, which is expected since it was shown that change in population had not affect in change of mangrove cover, which means the hotspot of mangrove cover loss could be a result of a different factor unaccounted for.
Discussion
Though there was no connection between change in population with change in mangrove cover, and mangroves loss is happening further away from settlements, there are a few areas that could be of interest. For future analysis, agriculture may play a role in mangrove cover loss (Harvey et al. 2014). Areas surrounding mangroves in our study site were found to be agriculture on google earth. Lime production is also a growing factor in Madagascar, which involves the use of deforesting mangroves for kiln fuel, and space for producing lime (Scales et al. 2017). All of these interactions will lead to a decline in mangrove carbon storage and loss of biodiversity (Donato et al. 2011. Das 2017).
Appendix
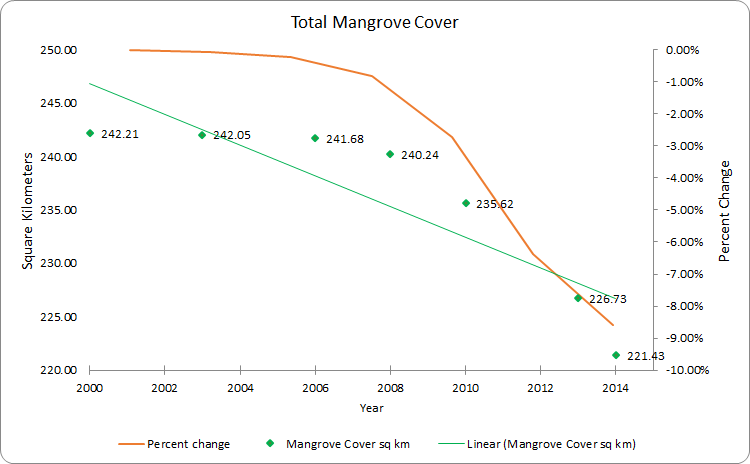
Figure 1. Mangrove cover over time. Left Y-axis is mangrove cover in square kilometers. Right Y-axis is mangrove percent change relative to year 2000.
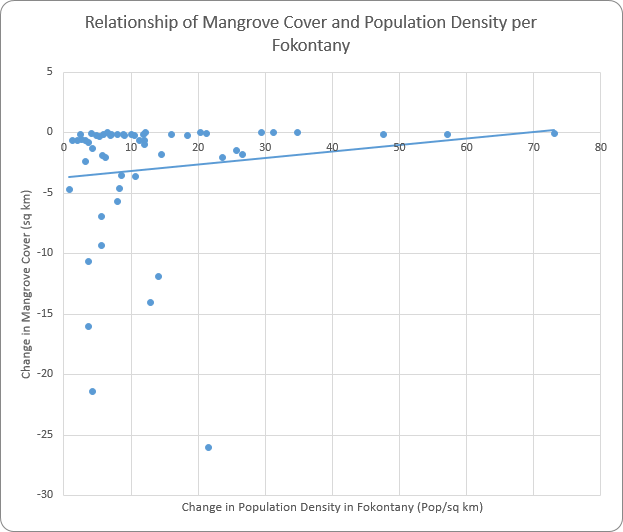
Figure 2. Scatterplot of change in mangrove and change in population density. Mangrove is being lost, but there is no relationship p = 0.326157 r = 0.01854.
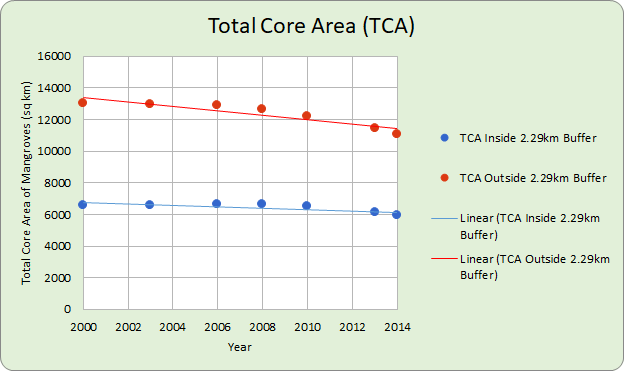
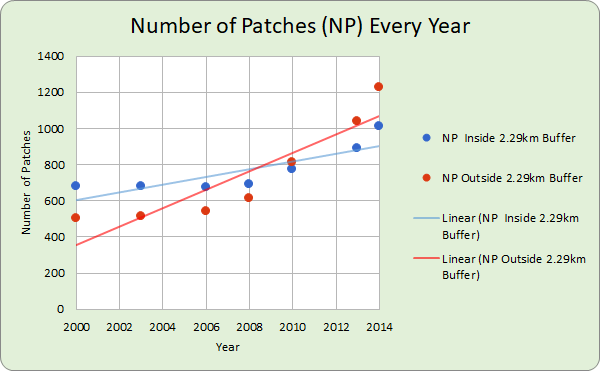
Figure 3. NP inside buffer p = 0.01626, Sen’s slope 51.75. NP outside buffer p = 0.00267, Sen’s slope 345.285. Both NP trend are significant, Sen’s slope confirms NP outside buffer experiences higher fragmentation rate. TCA inside buffer p = 0.2296, Sen’s slope -109.65. TCA outside buffer p = 0.00267, Sen’s slope -131.25. Both TCA are decreasing, however only TCA outside buffer trend is significant.
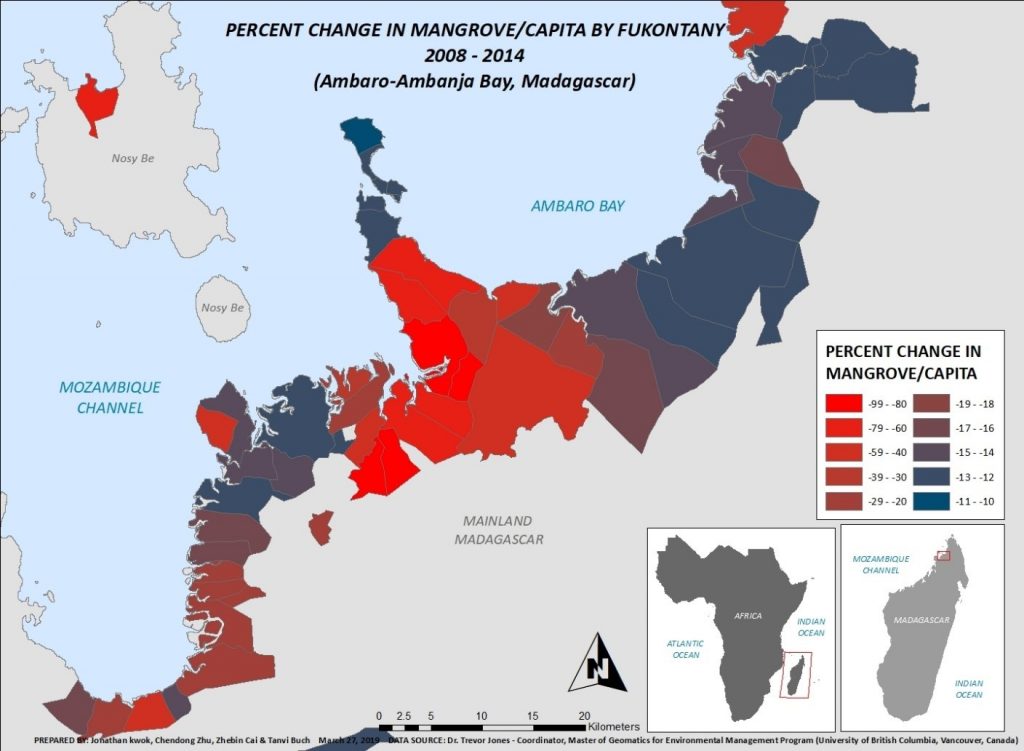
Figure 4. Percent loss of mangrove cover for each fukontany of our study site. It is confirmed that it is not population driven, other factors are yet to be looked at such as agriculture and lime production.
References
Buelow, C. and Sheaves, M. 2015. A birds-eye view of biological connectivity in mangrove systems. Estuarine, Coastal and Shelf Science 152: 33-43.
Das, S. 2017. Ecological Restoration and Livelihood: Contribution of Planted Mangroves as Nursery and Habitat for Artisanal and Commercial Fishery. World Development 94: 492-502.
Donato, D. C., Kauffman, J. B., Murdiyarso, D., Kurnianto, S., Stidham, M., Kanninen, M. 2011. Mangroves among the most carbon-rich forests in the tropics. Nature Geoscience 4: 293-297.
Quimby, B. 2015. Emerging customs: Small-scale fishing practices in Aceh, Indonesia. Applied Geography 59: 125-130.
Harvey, C. A., Rakotobe, Z. L., Rao, N. S., Dave, R., Razafimahatratra, H., Rabarijohn R. H., Rajaofara, H., Mackinnon, J. L. 2014. Extreme vulnerability of smallholder farmers to agricultural risks and climate change in Madagascar. Phil. Trans. R. Soc. B 369.
Rahdarian, A., Niksokhan, M. H. 2017. Numerical modeling of storm surge attenuation by mangroves in protected area of mangroves of Qheshm Island. Ocean Engeneering 145: 304-315.
Scales, I. R., Friess, D. A., Glass, L., Ravaorinorotsihoarana, L. 2017. Rural livelihoods and mangrove degradation in south-west Madagascar: lime production as an emerging threat. Oryx 52(4): 641-645.
Teh, L. C. L., Teh L. S. L., Meitner, M. J. 2012. Preferred resource spaces and fisher flexibility: Implications for spatial management of small-scale fisheries. Human Ecology 40(2): 213-226.
Tran, L. X., Fischer, A. 2017. Spatiotemporal changes and fragmentation of mangroves and its effects on fish diversity in Ca Mau Province (Vietnam). Journal of Coastal Conservation 21(3): 355-368.