Recomendation to the REDD and Executive Council: Panama Carbon Credits
Overview
In 2000, Panama committed to two national objectives as an initiative to receive REDD+ funding intended to be used for sustainable agricultural incentives: 1) reduce deforestation of mature forest, and 2) increase forest area through agroforestry plantations. Taking a combined national-level and project-based approach, what follows is evidence to support our overall position that Panama has partially met its objectives and qualifies for REDD+ funding.
Reduced Deforestation of Mature Forest
As seen in Figure 1, Panama’s landscape has undergone a rapid conversion of mature forest to cropland and fallow areas for subsistence and commercial agriculture from 1992 to 2008. Despite this trend of deforestation, analysis of forest loss rates (Table 1) between the baseline period (1992-2000) and the current analysis (2000-2008) show that deforestation has slowed after committing to Objective 1. Between 2000-2008, the national rate of deforestation decreased by ~143,450 hectares over 9 years (or ~15,939 hectares annually) as compared to the baseline (Table 1). This has resulted in an increase of ~20,083Gt C (or ~20,083,015 Mg C, Table 1) of mature forest carbon storage at the national level. This national-level approach to deforestation rates directly targets the issue of leakage; used in conjunction with Figure 1, we do not see evidence of areas of increased deforestation as a side-effect to Objective 1.
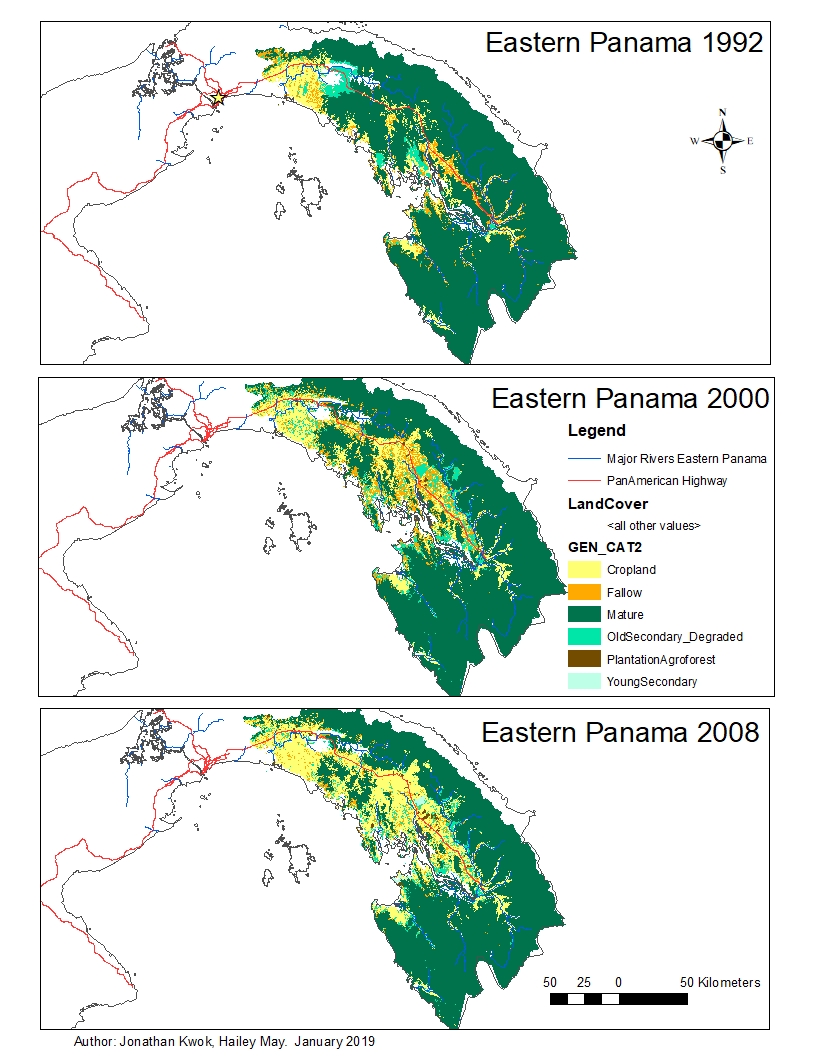
Figure 1. Map of landscape change patterns in Panama shown in 3 distinct years (9-year intervals). Data retrieved from Dr Jeanine M. Rhemtulla from the Faculty of Forestry, University of British Columbia.
Increased Forest Area through Agro-Forestry Plantations
Panama has partially met the objective to increase forest area through plantations. Using Table 2, evidence suggests that the probability of conversion of fallow land for planted forest is stable (at 0.002 for both time periods). The probability of conversion of cropland to agroforest, however, decreased by 0.001from the baseline (Table 2). Additionality cannot be proved in the case of reforestation, as 137.95 fewer hectares of crop/fallow land were converted to forest between 2000-2008 as compared to the baseline. A loss of approximately -2.34% reforested area occurred after Objective 2, thereby discrediting Panamas objective to increase forest area from the baseline.
Table 1. Change in the total land cover type and associated carbon storage potential over a 26-year period (9-year intervals) in Panama (in hectares and Mg ha-1, respectively). Total carbon = total area (ha) x carbon content per ha (in Mg ha-1).
| Time period | 1992-2008 | 2000-2008 | Difference from baseline | Mean rate of change/year (1992-2000) | Mean rate of change/year (2000-2008) |
| Change in mean total carbon per area (Mg ha-1) | -8.64 | -7.08 | +1.56 | – | – |
| Change in total carbon storage (Mg ha-1) | +18,281,359.93 | +14,975,365.33 | +3,305,994.60 | -2,031,262.21 | -1,663,929.48 |
| Change in mature forested area (ha) | -210,756.02 | -67,305.90 | +143,450.11 | -23,417.34 | -7,478.43 |
| Change in reforested area (ha) | +5,953.73 | +5,815.78 | -137.95 | +661.53 | +646.20 |
| Change in carbon storage from deforestation (Mg ha-1) | -29,505,842.34 | -9,422,826.44 | +20,083,015.89 | -3,278,426.93 | -1,046,980.72 |
| Change in carbon storage from reforestation (Mg ha-1) | +297,686.51 | +290,789.02 | -6,897.48 | +33,076.278 | +32,309.89 |
Table 2. Markov transition probability matrix for landscape change in Panama between 1992-2000 (Baseline = black) and 2000-2008 (Current period = red).
| Cropland | Fallow | Plantation agroforest | Mature forest | |
| Cropland | 0.956 / 0.998 | 0.023 / 0.001 | 0.002 / 0.001 | 0.009 / 0 |
| Fallow | 0.040 / 0.071 | 0.916 / 0.924 | 0.002 / 0.002 | 0.022 / 0.001 |
| Plantation agroforest | 0 / 0.004 | 0 / 0.001 | 0 / 0.995 | 0 / 0 |
| Mature forest | 0.007 / 0.004 | 0.007 / 0 | 0 / 0 | 0.981 / 0.994 |
Conclusions and Recommendations
As Panama has met ½ of its stated Objectives, we recommend partial funding for the amount of additional carbon sequestered from the decrease in deforestation at the national level, i.e. 20,083 Gt. Using the broad approach outlined for Panama in Potvin et al. (2008), setting a price inclusive of transaction, opportunity, and maintenance costs for retaining mature forest would equal US $917/ha/year, for a total of $131,588,206 over the 9-year period from 2000-2008. This price is a coarse-scale measurement across the country and does not reflect changes in landscape quality or personal opportunity costs. In order to address permanence, we recommend providing funding on an interim basis (ex: bi-annually) with the requirement for Panama to maintain or decrease its rate of deforestation over another 9-year period from 2008-2016 using 2000-2008 as the baseline. We do not recommend providing funding for increased reforestation without further evidence of increased rates of crop/fallow land conversion.
Literature Cited
Farrior, C. E., Bohlman, S. A., Hubbell, S. P., & Pacala, S. W. (2016). Supplementary Materials for “Dominance of the suppressed: Power-law size structure in tropical forests.” Science, 351(6269), 1–14.
Hoellein, T. J., Zarnoch, C. B., & Grizzle, R. E. (2015). Eastern oyster (Crassostrea virginica) filtration, biodeposition, and sediment nitrogen cycling at two oyster reefs with contrasting water quality in Great Bay Estuary (New Hampshire, USA). Biogeochemistry, 122(1), 113–129. https://doi.org/10.1007/s10533-014-0034-7
Hurst, J. M., Allen, R. B., Coomes, D. A., & Duncan, R. P. (2011). Size-specific tree mortality varies with neighborhood crowding and disturbance in a montane Nothofagus forest. PLoS ONE, 6(10). https://doi.org/10.1371/journal.pone.0026670
Larsen, M. C. (2017). Contemporary human uses of tropical forested watersheds and riparian corridors: Ecosystem services and hazard mitigation, with examples from Panama, Puerto Rico, and Venezuela. Quaternary International, 448, 190–200. https://doi.org/10.1016/j.quaint.2016.03.016
Pelletier, J, Kirby, K.R., & Potvin, C. (2012). Consequences of carbon stock uncertainties on emissions reductions from deforestation and forest degradation in developing countries. Forest Policy and Economics, 24, 3–11.https://doi.org/10.1016/j.forpol.2010.05.005
Potvin, C., Guay, B., & Pedroni, L. (2008). Is reducing emissions from deforestation financially feasible? A Panamanian case study. Climate Policy 8(1), 23-40. https://doi.org./ 0.3763/cpol.2007.0386
Velásquez Runk, J., Negría, G. O., García, W. Q., & Ismare, C. Q. (2007). Political economic history, culture, and Wounaan livelihood diversity in eastern Panama. Agriculture and Human Values, 24(1), 93–106. https://doi.org/10.1007/s10460-006-9035-z