This week’s exercise was challenging in both novelty and scope. I have never had to envision a ‘web’ of connections in this manner, and it’s not that I haven’t used data. As a school administrator I use surveys and assessment data frequently, but these are often displayed as percentages, in bar or pie charts, or in Likert scales. Having to analyze data on a complex web of nodes and edges is new to me, and represents a shift into the ‘guts’ of data analysis that I’m not used to.
I puzzled over the interpretation and analysis of the data on the Palladio app, trying to make some sense of the complex web that it presented. It also made me appreciate the vastly more complex algorithms that drive social media. I used AI, (ChatGPT, personal communication, March 8, 2025), to help me understand what a .json file was, and how it arrived at the communities that the app afforded. From there, I dove, (without AI), into the tangle that the Palladio app provided.
One thing I wonder is about what I didn’t do, namely, that I took creative license with the previous assignment and only included eight of the Golden Record tracks. I added two tracks that were not on the original recording, (please see rationale here). I wonder how my absence from 20% of the requested assignment affected the data, not only from my own perspective, but how it may affect the connections to, and for, other students in this course.
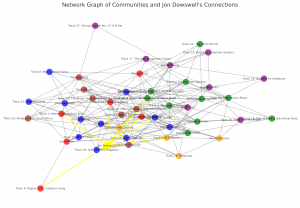
I did notice that there were a few other students who shared similar choices and, hence, their inclusion in a social network with me. It seems that Patrick and Quinn made similar choices as me, and thus we end up in a community of sorts.
Another observation of the data indicates that my particular community is not the largest nor smallest of the groups, which makes me wonder about the choices and rationales provided by my peers in the previous assignment. Are the largest communities more diverse? Or simply connected by popular choices? Are the smaller communities more consistent in, if specific, their choices? Which types of communities are further ‘down the rabbit hole’?
I think that another, and perhaps more consequential, piece of data that is missing are the tracks we left out. At this point I don’t know why certain tracks were omitted from the lists of the other students in this course, and I can only account for mine. What might this visualization look like if we explicitly chose the tracks to leave off of the Golden Record? I wonder if we did both exercises – what to keep and what to omit – how the two would and would not overlap?
Ultimately, this feels like a quantitative experiment, one where a relatively simple set of raw data provides “relationships”, (in quotation marks, due to the fact that I do not have an authentic interpersonal relationship with any of the folks in even my closest ‘community’), rather than a qualitative investigation that draws upon shared values, experiences, or tastes.
This contrasts with last week’s exercise where we explicitly engaged in a qualitative challenge – justifying the inclusion of certain tracks over another. During that study, I weighed socio-historical impact, inclusion, population and demographics, and other values I felt had the most meaning. In short, they were a reflection of me and my experiences, not of a data set.
Those within my ‘community’ of musical choices may have had similar experiences in their lives, or held certain values that connected with my own, therefore guiding their choices. However, given the rather narrow scope of the assignment, (not a critique, but a recognition that twenty-plus individuals were making decisions on the value of twenty-plus songs, and therefore not an overarching societal statement), it would be rash to assume rationales, cultural backgrounds, reasoning, emotions, preferences, or even momentary moods and their influences upon the track selections. In short, I wouldn’t assume a personal connection based on the nodes and edges we see here.
I think what’s most important here is what we don’t know. I would, as mentioned above, be curious if the previous assignment was about what to exclude rather than what to include. What am I missing about certain tracks, and what are my biases in this survey?
In the larger context, I wonder what my ‘network’ would think of, and influence, my choices. Would more data help me understand and acknowledge more diverse communities, or would it double down and reinforce my pre-existing biases and understandings? Unfortunately, I think modern social media trends towards the latter.