Task 11: Algorithms | Detain Release

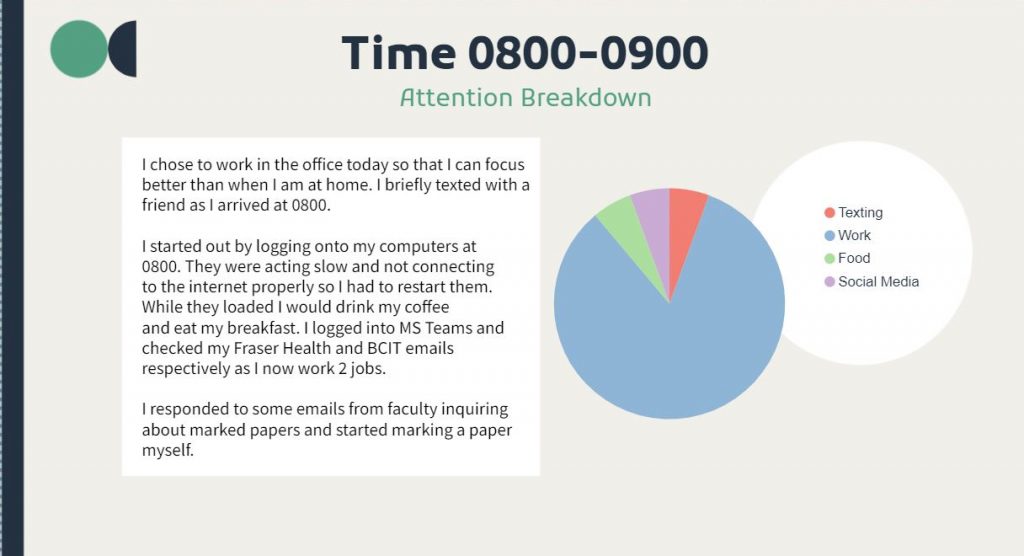
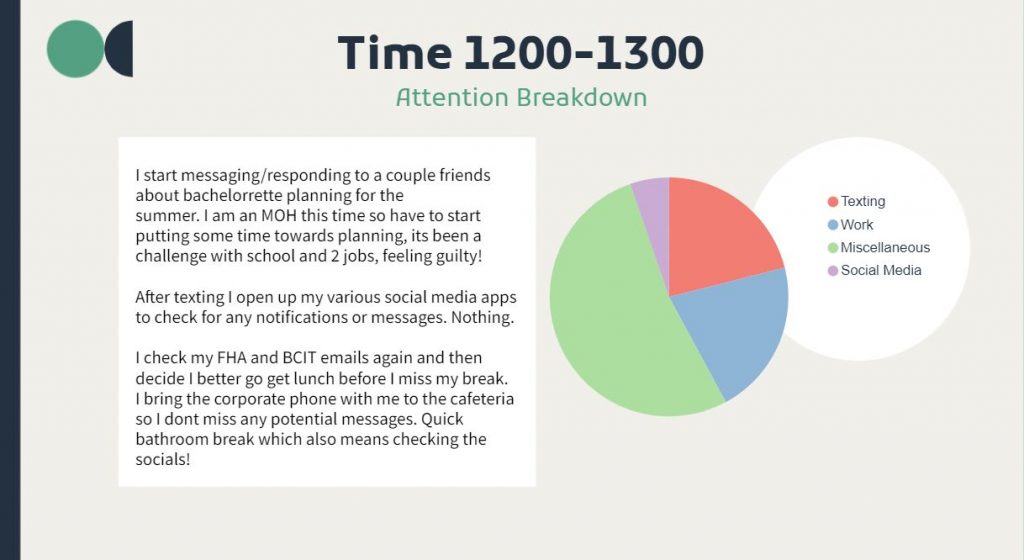
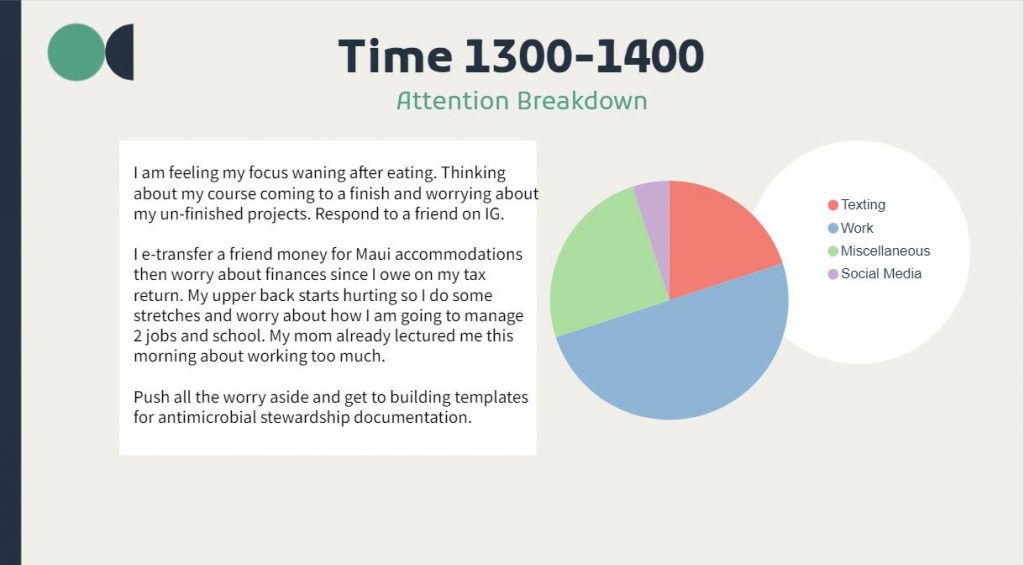
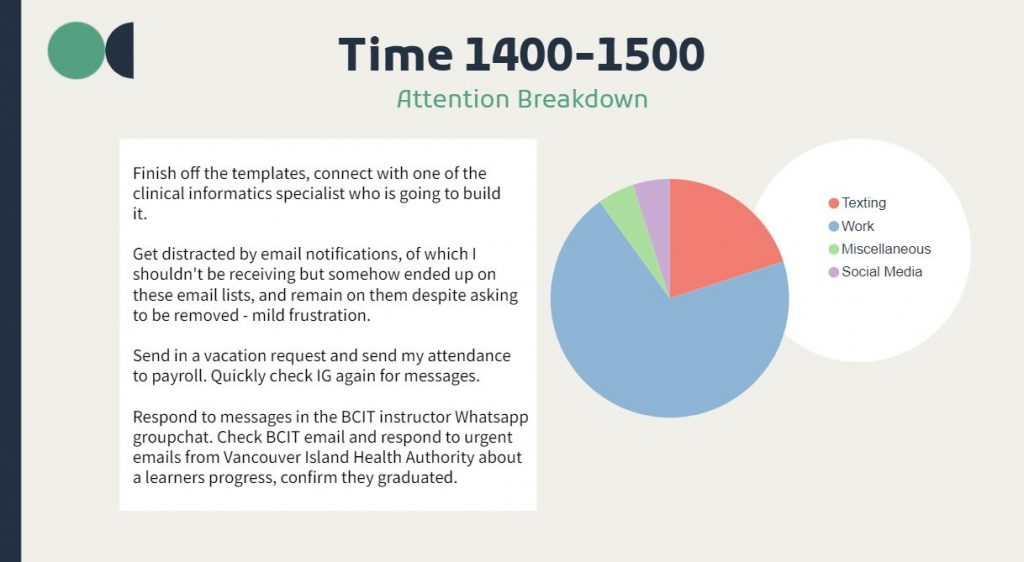
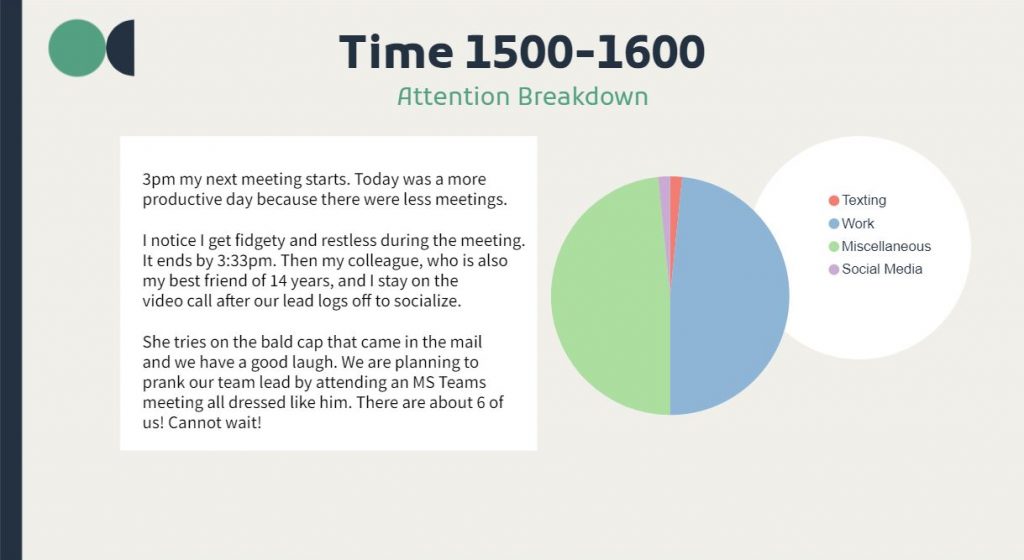
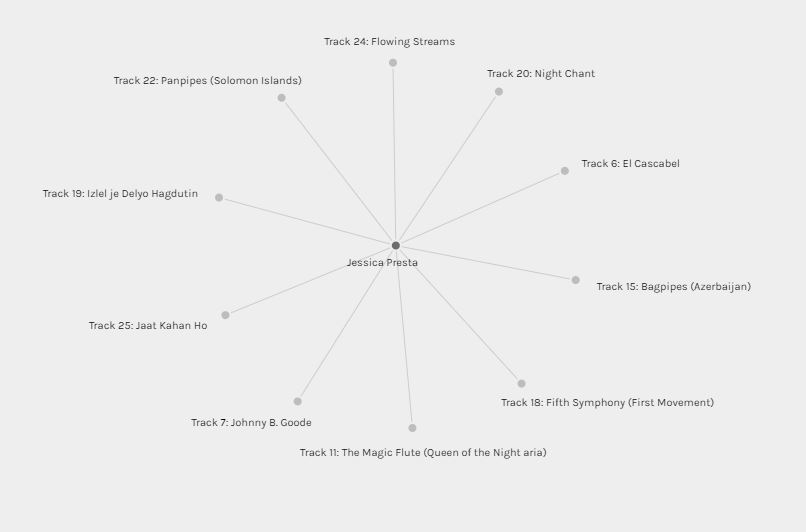
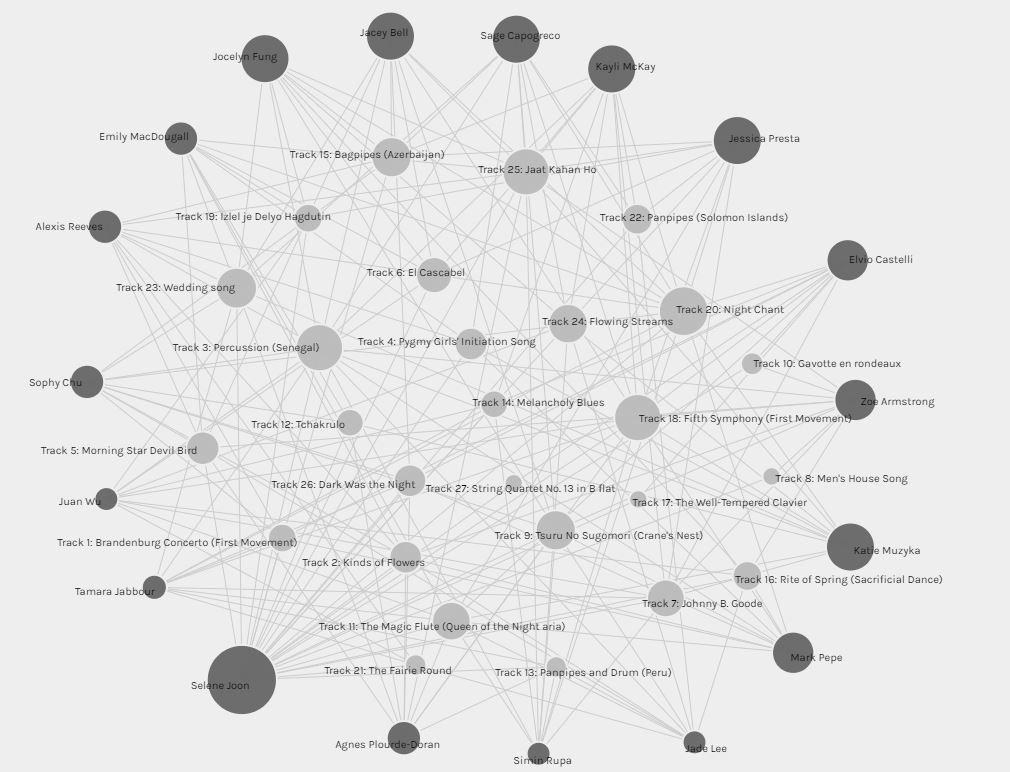
This week I decided to dive into the world of algorithms seeing as this topic is gaining traction the more we become aware of their pervasive use in everyday life. Knowingly, I engaged with an algorithmic, simulated activity called ‘Detain/Release’. The premise of the activity is to engage with a simulated, pretrial algorithmic assessment tool. You review the cases of 25 defendants, choosing to either detain or release them based on their risk assessment and some other limiting pieces of information. Here is an example of what information you are given to make this decision:

During the activity, I quickly realized I am not cut out for law enforcement! First off, I found myself leaning towards trusting the defendants testimony and opted to release them more often than detain them. Maybe it is the nursing background, but, I really did not like making the decision to detain someone. Secondly, I knew that an algorithm was making suggestions about the potential risk of releasing these individuals. With that knowledge, and knowledge of algorithmic limitations in judgement, I found myself less trusting of the AI’s recommendation than the individual. Due to these conflicting thoughts, and an enormous lack of context, I struggled to make a decision to detain or release the 25 suspects.

Kate Crawford does an excellent job of highlighting the limitations of algorithms and AI in her book (image links to a video), Atlas of AI. She discusses in detail how algorithms reinforce oppression due to embedded bias in datasets and uses a dataset of mugshots to make her case. Crawford (2021) identifies how these images are stripped from their context and are taken during times of extreme vulnerability without consent. These images then become data sets and there is this presumption that what the machine ‘sees’ is neutral. Crawford (2021) argues that these images are anything but neutral. “They represent personal histories, structural inequities, and all the injustices that have accompanied the legacies of policing and prison systems in the United States” (Crawford, 2021, p. 94).

I watched another TedX video by Hany Farid on the danger of predictive algorithms in law enforcement. I would recommend starting the video at 4:49. Hany Farid (2018) does an excellent job of proving Crawford’s points mentioned above. He walks the audience through a study they did which demonstrates how racism can be embedded in predictive modelling software as a result of systematic inequities. In the US, an African American is more likely to have a criminal record due to long standing societal and systematic injustices. Therefore, when prior criminal records are used as a data point for predictive modeling to determine risk of re-offence, the algorithms will be inherently biased to choose African American individuals. His study also demonstrated how these so-called advanced technologies have the same predictive abilities as a random person from the street. Thus, algorithms which are supposed to be overcoming these social issues are merely mirroring and replicating them. “Big data, data analytics, AI, ML, are not inherently more accurate, more fair, less biased than humans.” So why do we use them?

Anecdotally, I contacted a friend of mine who works in law enforcement on Vancouver Island to share with him the Detain and Release activity along with the article about this type of policing. I wanted to hear what he had to say from his perspective. To my pleasant surprise, he was quite aware of these tools and their limitations, he continued to explain that it isn’t used at his detachment but stated larger detachments might use it. However, he did acknowledge how minorities and poor communities experience higher rates of crime and how these tools can perpetuate that cycle of over policing. He said if we were to look at what is being done with the justice system in Canada with decriminalizing drug possession for personal use and petty crimes, and the culture of the judge not staying charges or not enforcing conditions of release, this becomes a beginning place to start combating these inequities.

References

Crawford, K. (2021). The Atlas of AI.

Farid, H (2018). Retrieved from YouTube: https://www.youtube.com/watch?v=p-82YeUPQh0

Task 10: Attention Economy

This had to be the most frustrating site to visit! Talk about terrible UI design. In all honesty, I had to YouTube how to get past the initial first 2 pages. because I was going in circles! It was very interesting being aware of and observing my reaction to the pop-ups and notifications during this activity, and how they drew my attention away from the task of filling out the online form.

This emphasis on attention, and our new found attention economy where the main form of currency is an end users attention span, had me reflecting on my own and what competes for it. To get a sense of what I ‘spend’ my attention on, I created a 12 hour record of an average work day, keeping track of things that required… or rather demanded, my attention. I decided to break my attention record down into hour intervals and grouped my activities under 4 main headings; Texting, Work, Miscellaneous (eating, going to the bathroom etc.) and Social Media. Below is my record!

What this attentional record captures is a high level of multitasking, as well as highlights the frequency in which I am on my phone either messaging or using social media. Every hour, without fail, I was on my phone! Messaging friends and family, as well as checking my social media apps. To me, this is a great example of what Harris (2017) describes as scheduling blocks of time in our day to engage with, or more aptly, get sucked into social media. This highlights how much control these persuasive technologies and their algorithmic counterparts have on keeping our attention in their race to the bottom of our brainstems (Harris, 2017). It is increasingly important, now more than ever, to be cognizant of our attentional habits and hygiene. As Harris (2017) also identifies, we need to maintain our boundaries of human capacity, remain engaged in real life, with one another, and stay focused on the bigger issues of the world, such as our current climate crisis.

References

Harris, T. (2017). How a handful of tech companies control billions of minds every day. Retrieved from https://www.ted.com/talks/tristan_harris_the_manipulative_tricks_tech_companies_use_to_capture_your_attention?language=en

Task 9: Network Assignment

Understanding the inner workings of the web, how content within it is connected, and how search engines (ie algorithms) operate is increasingly important as our lives become enmeshed with and reliant on technology. This entanglement between algorithms and humans is at times, undetectable. Within this post, I will discuss how online behavior generates data which algorithms then organize, add value to, and make inferences from along with its limitations. Understanding this allows the end user, such as you and I, to interpret information being presented to us when we use search engines such as Google. To do this, I will use a networked graph that was generated using datasets from my course.

For our last activity, each classmate had to narrow down a list of 27 songs from the interstellar Golden Record to just 10 songs. Our professor took this dataset and entered it into a program called Palladio. This program takes datasets and creates a networked graph out of it for the purposes of interpreting relationships among the data. I found analyzing this graph initially challenging as interpreting data presented in this format was new for me.

Here is a representation of the songs I chose, in isolation from the rest of the class. In this graph, my person and the songs are considered the entity, also known as the nodes which are then linked by edges (Systems Innovation, 2015). In this graph, these edges represent the relationship between the source node (myself) and the targeted nodes (my song choices). One could argue that this is a directed graph due to the orientation and relationship of the source and targeted nodes. The source node is reflected by the darker shading while the target node is reflected by the lighter shading. I chose the songs, the songs did not choose me, therefore the direction in this graph only goes one way.

When we add more nodes (all of the other classmates and their song choices) and represent the various relationships (edges) between them, we end up with a multi-graph like the one below (Systems Innovation, 2015). In order to better understand and derive more meaning from this graph, I chose to organize the nodes and adjusted the settings to show the weight of relationships by size. This in turn, created a weighted graft where the size of the node represents the weight of its relationships. Classmates who chose less than ten songs from the list have a smaller sized node, and those who chose more than ten songs have a much larger node. One classmate chose all 27 songs and are represented by the largest node in the multi-graph. When it comes to the connectivity of the target nodes to the source nodes, the more often a song was chosen, the larger the node is. For example, track 3, 18, 20, and 25 were the top selected songs from the class.

Thinking about my role in health care and how the Health Authority’s across the province are transitioning to a digitized system, I cannot help but wonder how health data/informatics would be represented by these multi-graphs. I would imagine it would create layers upon layers of these webs of health data.

But what is the significance of this data? What does it represent? How would we interpret this without any context? From just looking at this graph, I am unable to decipher why someone may have chosen these songs. Personally, I just chose what I thought sounded the nicest to listen to. I somewhat kept the idea of extraterrestrial life potentially listening to them in the back of my mind, therefore diversified the list slightly, however it did not play a big role in my decision making.

If we were to take this one step further, and think about the complexity of online behavior and the relationships we generate through online activity, we can begin to see how this behavior can be monitored to produce data points like the above. A person, represented by a source node, can have their online activity generate target nodes, which can then become connected to other target nodes creating edges. The more online activity, the more data produced and relationships identified. This online behavior when tracked, likely results in multiplex networks, allowing algorithms to make inferences and conclusions about us and what we like in order to deliver targeted ads (among other things). This has me reflecting on the problem of algorithms generating what Rodney (2020) calls our data doubles. I am going to leave you with this concluding thought, which is an an entire excerpt from Rodney, J.’s (2020) article which can be found on page 32, because it was very impactful for me and is something I have not forgotten over a year later:

As we can see, raw data lacks context, and when algorithms attempt to make meaning out of data that is not contextualized, misinterpretations are bound to happen. These errors in algorithmic judgement can have lasting, negative impacts on those exposed to them. Sadly, there are more and more examples coming to light of the bias inherent to AI. What would these errors in judgement and machine learning look like in the context of health care? Would you be comfortable having AI make health care decisions on your behalf? What is an acceptable margin for error in something like this? As we move to digitizing the health care system… it is only a matter of time before algorithms start creeping into this sector.

References

Jones, Rodney H.. “1 The rise of the Pragmatic Web: Implications for rethinking meaning and interaction”. Message and Medium: English Language Practices Across Old and New Media, edited by Caroline Tagg and Mel Evans, Berlin, Boston: De Gruyter Mouton, 2020, pp. 17-37. https://doi.org/10.1515/9783110670837-003

Systems Innovation. (2015, April 18). Graph Theory Overview [Video]. YouTube. https://youtu.be/82zlRaRUsaY

Systems Innovation. (2015, April 19). Network connections [Video]. YouTube. https://www.youtube.com/watch?v=2iViaEAytxw

Task 8: Golden Record

This weeks content had me deeply reflecting about life, and the miracle that is life as we exist on this rock, spinning in space. To think that there are a potential 130 other planets capable of supporting life and the potential of other intelligent beings in the universe is quite remarkable. However, is attempting to make contact and giving our coordinates within the universe something we should be doing? I am not so certain! Alas, here we are with the Voyager, in interstellar space, some 14.52 billion miles away (NASA/JPL-Caltech, 2022)!

After this weeks readings, I found myself reflecting on the medium which we use for the curation, consuming and storing of various texts. I also thought about the medium we use to view these texts and how taking something previously analog and digitizing it, can impact their authenticity and value. As I thought about these things, I thought about how they would apply to the medium that was used to store and share texts with the Golden Record. In light of this, I did some searching and learned that it is a gold plated, copper disc, with electroplated uranium on the outside to delay, as much as possible, the degradation of the information on the disc. Unlike a digital file that could ‘decay’ when the technology becomes obsolete (Smith, 1999), the precious metals and uranium used for the Golden Disc can prevent the disc from decaying for… well it has the potential to outlive humanity and the earth!

The other piece I found myself thinking about is the sheer amount of assumptions made on the part of the creators regarding the ability of another intellectual life form being able to understand these sounds, images and symbols. So much thought and detail was required to curate this time capsule, filling it with texts that represent humanity and life on Earth. But who is to say these messages will ever be decoded if found?  During the podcast, Dallas Taylor discusses how Carl Sagan, and other creators of the disc adjusted the speed so that they could pack as much information onto the disc as possible. This gain in space meant there would be a loss in sound quality (Smith, 1999). The other thought I had was regarding the ability to extract this data from the Golden Record if it indeed was found. In all my searching, I could not find proof that a record player was sent along with the disc. This information is entirely dependent on a “machine to decode” it, generating sounds that will transmit the messages embedded on the disc. Without that, this data has no value (Smith, 1999, p. 4). If found, would the founders have the technology to play the disc? Luckily for me, I can stream the track list on YouTube!

Of the 27 songs, these are the ten I ended up choosing. It was definitely challenging to narrow down the list to only ten songs, which shed some insight on how challenging it must have been to only have 27 spots available on the Golden Record. This also coincides with the importance of curating large enough selections of texts to provide appropriate context. Is this collection of ten songs big enough to provide sufficient context of human life to extraterrestrial beings (Smith, 1999)? I don’t feel as though I have accomplished this with the ten I have selected, although I tried my best to represent various cultures and styles of music, that were interesting to me. I also found that I preferred songs that were more advanced in their sound quality… perhaps reflecting my tendency towards digitally mastered music.

  • Track 6: El Cascabel
  • Track 7: Johnny B. Goode
  • Track 11: The Magic Flute (Queen of the night)
  • Track 15: Bagpipes (Azerbaijan)
  • Track 18: 5th Symphony (First movement)
  • Track 19: Islel je Delyo Hagdutin
  • Track 20: Night Chant
  • Track 22: Panpipes (Solomon Islands)
  • Track 24: Flowing Streams
  • Track 25: Jaat Kahan Ho 

References

NASA/JPL-Caltech. Retrieved July 9th, 2022, from https://voyager.jpl.nasa.gov/mission/status/

Smith Rumsey, A. (1999, February). Why Digitize? Retrieved July 7th, 2022, from Council on Library and Information Resources website: https://www.clir.org/pubs/reports/pub80-smith/pub80-2/

Spam prevention powered by Akismet