Task 10: Attention Economy

This had to be the most frustrating site to visit! Talk about terrible UI design. In all honesty, I had to YouTube how to get past the initial first 2 pages. because I was going in circles! It was very interesting being aware of and observing my reaction to the pop-ups and notifications during this activity, and how they drew my attention away from the task of filling out the online form.

This emphasis on attention, and our new found attention economy where the main form of currency is an end users attention span, had me reflecting on my own and what competes for it. To get a sense of what I ‘spend’ my attention on, I created a 12 hour record of an average work day, keeping track of things that required… or rather demanded, my attention. I decided to break my attention record down into hour intervals and grouped my activities under 4 main headings; Texting, Work, Miscellaneous (eating, going to the bathroom etc.) and Social Media. Below is my record!

What this attentional record captures is a high level of multitasking, as well as highlights the frequency in which I am on my phone either messaging or using social media. Every hour, without fail, I was on my phone! Messaging friends and family, as well as checking my social media apps. To me, this is a great example of what Harris (2017) describes as scheduling blocks of time in our day to engage with, or more aptly, get sucked into social media. This highlights how much control these persuasive technologies and their algorithmic counterparts have on keeping our attention in their race to the bottom of our brainstems (Harris, 2017). It is increasingly important, now more than ever, to be cognizant of our attentional habits and hygiene. As Harris (2017) also identifies, we need to maintain our boundaries of human capacity, remain engaged in real life, with one another, and stay focused on the bigger issues of the world, such as our current climate crisis.

References

Harris, T. (2017). How a handful of tech companies control billions of minds every day. Retrieved from https://www.ted.com/talks/tristan_harris_the_manipulative_tricks_tech_companies_use_to_capture_your_attention?language=en

Task 9: Network Assignment

Understanding the inner workings of the web, how content within it is connected, and how search engines (ie algorithms) operate is increasingly important as our lives become enmeshed with and reliant on technology. This entanglement between algorithms and humans is at times, undetectable. Within this post, I will discuss how online behavior generates data which algorithms then organize, add value to, and make inferences from along with its limitations. Understanding this allows the end user, such as you and I, to interpret information being presented to us when we use search engines such as Google. To do this, I will use a networked graph that was generated using datasets from my course.

For our last activity, each classmate had to narrow down a list of 27 songs from the interstellar Golden Record to just 10 songs. Our professor took this dataset and entered it into a program called Palladio. This program takes datasets and creates a networked graph out of it for the purposes of interpreting relationships among the data. I found analyzing this graph initially challenging as interpreting data presented in this format was new for me.

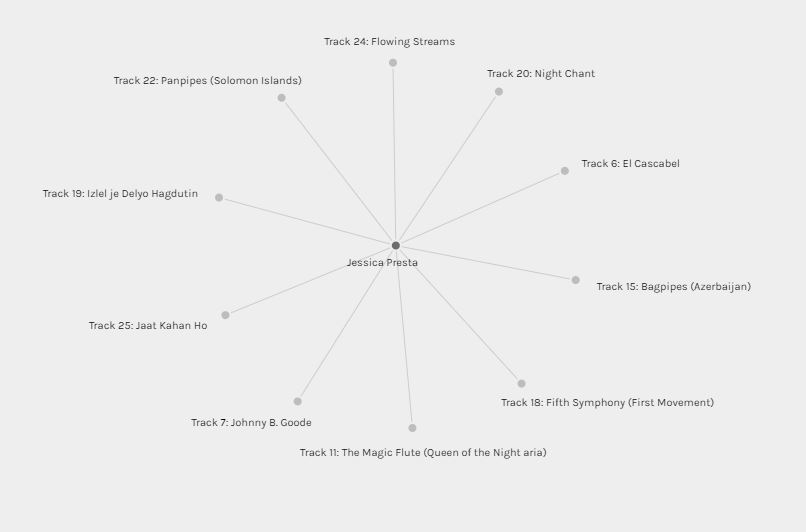
Here is a representation of the songs I chose, in isolation from the rest of the class. In this graph, my person and the songs are considered the entity, also known as the nodes which are then linked by edges (Systems Innovation, 2015). In this graph, these edges represent the relationship between the source node (myself) and the targeted nodes (my song choices). One could argue that this is a directed graph due to the orientation and relationship of the source and targeted nodes. The source node is reflected by the darker shading while the target node is reflected by the lighter shading. I chose the songs, the songs did not choose me, therefore the direction in this graph only goes one way.

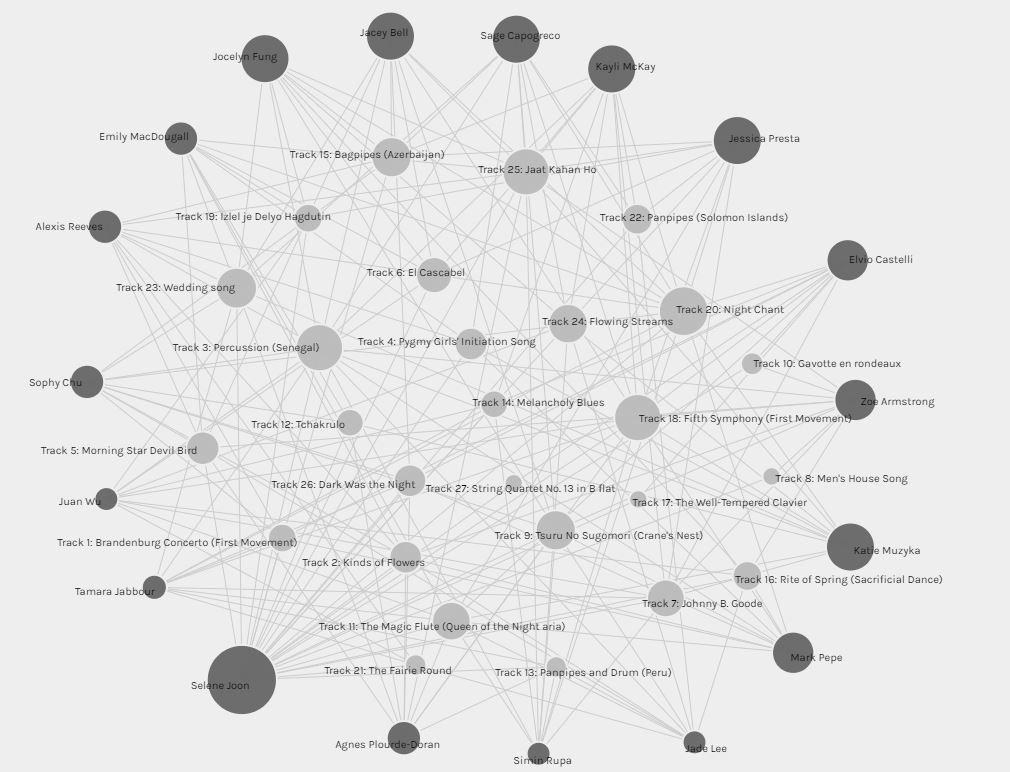
When we add more nodes (all of the other classmates and their song choices) and represent the various relationships (edges) between them, we end up with a multi-graph like the one below (Systems Innovation, 2015). In order to better understand and derive more meaning from this graph, I chose to organize the nodes and adjusted the settings to show the weight of relationships by size. This in turn, created a weighted graft where the size of the node represents the weight of its relationships. Classmates who chose less than ten songs from the list have a smaller sized node, and those who chose more than ten songs have a much larger node. One classmate chose all 27 songs and are represented by the largest node in the multi-graph. When it comes to the connectivity of the target nodes to the source nodes, the more often a song was chosen, the larger the node is. For example, track 3, 18, 20, and 25 were the top selected songs from the class.

Thinking about my role in health care and how the Health Authority’s across the province are transitioning to a digitized system, I cannot help but wonder how health data/informatics would be represented by these multi-graphs. I would imagine it would create layers upon layers of these webs of health data.

But what is the significance of this data? What does it represent? How would we interpret this without any context? From just looking at this graph, I am unable to decipher why someone may have chosen these songs. Personally, I just chose what I thought sounded the nicest to listen to. I somewhat kept the idea of extraterrestrial life potentially listening to them in the back of my mind, therefore diversified the list slightly, however it did not play a big role in my decision making.

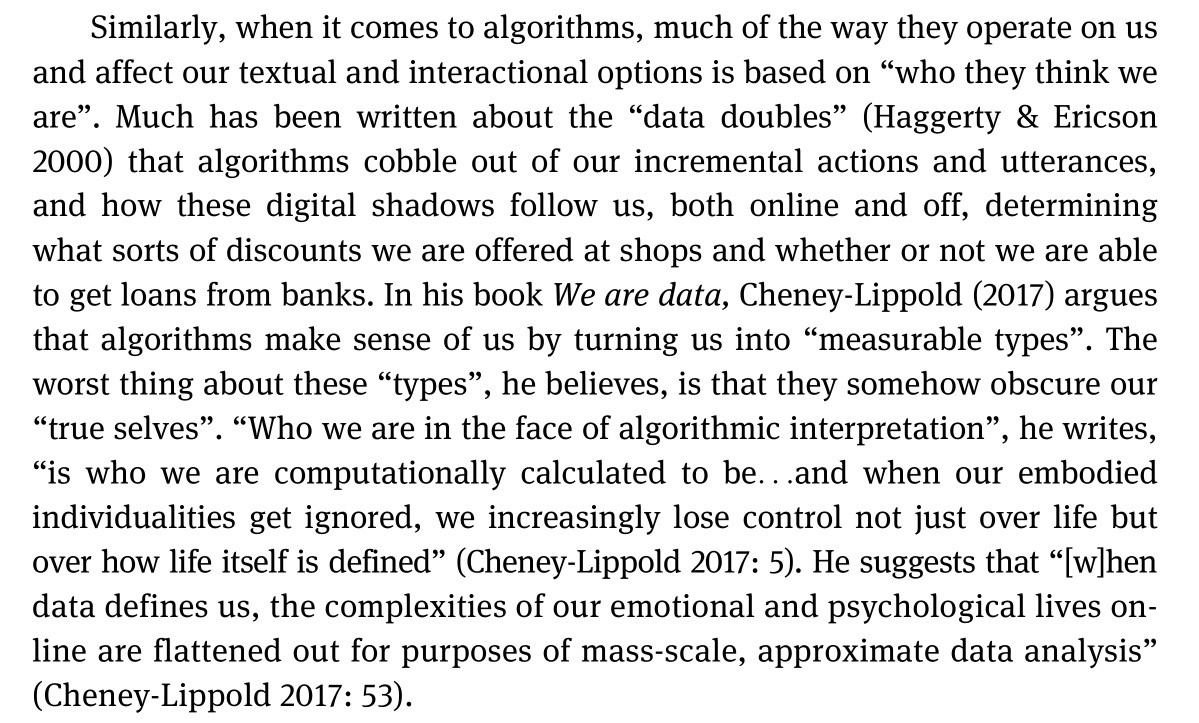
If we were to take this one step further, and think about the complexity of online behavior and the relationships we generate through online activity, we can begin to see how this behavior can be monitored to produce data points like the above. A person, represented by a source node, can have their online activity generate target nodes, which can then become connected to other target nodes creating edges. The more online activity, the more data produced and relationships identified. This online behavior when tracked, likely results in multiplex networks, allowing algorithms to make inferences and conclusions about us and what we like in order to deliver targeted ads (among other things). This has me reflecting on the problem of algorithms generating what Rodney (2020) calls our data doubles. I am going to leave you with this concluding thought, which is an an entire excerpt from Rodney, J.’s (2020) article which can be found on page 32, because it was very impactful for me and is something I have not forgotten over a year later:

As we can see, raw data lacks context, and when algorithms attempt to make meaning out of data that is not contextualized, misinterpretations are bound to happen. These errors in algorithmic judgement can have lasting, negative impacts on those exposed to them. Sadly, there are more and more examples coming to light of the bias inherent to AI. What would these errors in judgement and machine learning look like in the context of health care? Would you be comfortable having AI make health care decisions on your behalf? What is an acceptable margin for error in something like this? As we move to digitizing the health care system… it is only a matter of time before algorithms start creeping into this sector.

References

Jones, Rodney H.. “1 The rise of the Pragmatic Web: Implications for rethinking meaning and interaction”. Message and Medium: English Language Practices Across Old and New Media, edited by Caroline Tagg and Mel Evans, Berlin, Boston: De Gruyter Mouton, 2020, pp. 17-37. https://doi.org/10.1515/9783110670837-003

Systems Innovation. (2015, April 18). Graph Theory Overview [Video]. YouTube. https://youtu.be/82zlRaRUsaY

Systems Innovation. (2015, April 19). Network connections [Video]. YouTube. https://www.youtube.com/watch?v=2iViaEAytxw

Task 8: Golden Record

This weeks content had me deeply reflecting about life, and the miracle that is life as we exist on this rock, spinning in space. To think that there are a potential 130 other planets capable of supporting life and the potential of other intelligent beings in the universe is quite remarkable. However, is attempting to make contact and giving our coordinates within the universe something we should be doing? I am not so certain! Alas, here we are with the Voyager, in interstellar space, some 14.52 billion miles away (NASA/JPL-Caltech, 2022)!

After this weeks readings, I found myself reflecting on the medium which we use for the curation, consuming and storing of various texts. I also thought about the medium we use to view these texts and how taking something previously analog and digitizing it, can impact their authenticity and value. As I thought about these things, I thought about how they would apply to the medium that was used to store and share texts with the Golden Record. In light of this, I did some searching and learned that it is a gold plated, copper disc, with electroplated uranium on the outside to delay, as much as possible, the degradation of the information on the disc. Unlike a digital file that could ‘decay’ when the technology becomes obsolete (Smith, 1999), the precious metals and uranium used for the Golden Disc can prevent the disc from decaying for… well it has the potential to outlive humanity and the earth!

The other piece I found myself thinking about is the sheer amount of assumptions made on the part of the creators regarding the ability of another intellectual life form being able to understand these sounds, images and symbols. So much thought and detail was required to curate this time capsule, filling it with texts that represent humanity and life on Earth. But who is to say these messages will ever be decoded if found?  During the podcast, Dallas Taylor discusses how Carl Sagan, and other creators of the disc adjusted the speed so that they could pack as much information onto the disc as possible. This gain in space meant there would be a loss in sound quality (Smith, 1999). The other thought I had was regarding the ability to extract this data from the Golden Record if it indeed was found. In all my searching, I could not find proof that a record player was sent along with the disc. This information is entirely dependent on a “machine to decode” it, generating sounds that will transmit the messages embedded on the disc. Without that, this data has no value (Smith, 1999, p. 4). If found, would the founders have the technology to play the disc? Luckily for me, I can stream the track list on YouTube!

Of the 27 songs, these are the ten I ended up choosing. It was definitely challenging to narrow down the list to only ten songs, which shed some insight on how challenging it must have been to only have 27 spots available on the Golden Record. This also coincides with the importance of curating large enough selections of texts to provide appropriate context. Is this collection of ten songs big enough to provide sufficient context of human life to extraterrestrial beings (Smith, 1999)? I don’t feel as though I have accomplished this with the ten I have selected, although I tried my best to represent various cultures and styles of music, that were interesting to me. I also found that I preferred songs that were more advanced in their sound quality… perhaps reflecting my tendency towards digitally mastered music.

  • Track 6: El Cascabel
  • Track 7: Johnny B. Goode
  • Track 11: The Magic Flute (Queen of the night)
  • Track 15: Bagpipes (Azerbaijan)
  • Track 18: 5th Symphony (First movement)
  • Track 19: Islel je Delyo Hagdutin
  • Track 20: Night Chant
  • Track 22: Panpipes (Solomon Islands)
  • Track 24: Flowing Streams
  • Track 25: Jaat Kahan Ho 

References

NASA/JPL-Caltech. Retrieved July 9th, 2022, from https://voyager.jpl.nasa.gov/mission/status/

Smith Rumsey, A. (1999, February). Why Digitize? Retrieved July 7th, 2022, from Council on Library and Information Resources website: https://www.clir.org/pubs/reports/pub80-smith/pub80-2/

Task 6: An Emoji Story

I am very curious to know if anyone is able to guess what show I am referring to!

Wow! I thought this was going to be easier to execute than it was, considering my frequent use of emoji’s when messaging with friends and colleagues!

  • Did you rely more on syllables, words, ideas or a combination of all of them?

Interestingly, I ended up using emoji’s to reflect ideas and themes versus syllables or words. I believe this was because the emoji’s I had to choose from didn’t quite reflect the message I was hoping to convey. So instead of attempting to squeeze meaning out of a single emoji, I looked to grouping multiple emoji’s to convey a theme or idea. I also took this grouping and sequenced it to give more meaning and to provide a storyline. Struggling to make sure the emoji reflected what I was trying to say provided great insights into how these symbols, while carrying so much meaning, could lead to others misinterpreting, or not guessing correctly the story I am attempting to tell (Bolter, 2010). When you see an emoji symbol for a bag of money, this can have endless interpretations, leaving it up to the reader to make their best guess as to what the author is trying to say. Perhaps the saying “a picture is worth a thousand words” is misleading, as we don’t know which thousand words that picture could be referring to.

  • Did you start with the title? Why? Why not?

I did in fact start with the title. I think that is the best way to identify a topic and to provide structure around the message being portrayed. However, beginning with the title and structuring the sequence from left to right, top to bottom, reflects how language shapes the way I think. While I share culture and language with many others, this has not afforded me the ease to interpreting my classmates emoji stories. As I read through my peers emoji stories, I struggled to decipher both the title and plot of a show, sometimes I could guess the title while not be able to interpret the plot, and so on. This goes to show that despite being from the same culture, we all have our own unique way of attaching meaning to the images we are seeing. reinforcing the notion that “picture elements extend over a broad range of meanings” (Bolter, 2010, p.59).

  • Did you choose the work based on how easy it would be to visualize? 

I would say no, I didn’t. I wanted to attempt to depict a show that others might find funny or be as into as I am. I thought I would do better at this since I generally use emoji’s to provide an emotional context to my prose/written text. Trying to depict relationships between people alongside big emotions, with only emoji’s, was incredibly difficult. That aspect of the activity really drove home the argument Bolter (2010) makes regarding “narrative power” being lost entirely from “picture writing” (p. 59).

  • Breakout of the Visual

As I made my way through the readings this week (especially Bolter’s) I couldn’t help but wonder how Bolter’s perspective of what the breakout of the visual is would change if TikTok was thriving when this book was written. His book was published in 2010 and in 2016 TikTok made its debut. I cannot help but associate his idea of the visual breaking out to TikTok in all of its hypermediated glory. TikTok epitomizes the “hectic photomontage” (p. 51) that Bolter describes in hypermediated styles of prose. It does this by utilizing green screen features, allowing content creators to share multiple different images while speaking to what exists within those images, it also combines verbal and picture reading all the while listening to spoken words (Bolter, 2010). TikTok embodies the joining of “interactivity with the immediacy of a global hypertext” (Bolter, 2010, p. 70). Does TikTok improve the authenticity of content while providing immediacy for consumption of it? Can we determine if TikTok has remediated previous forms of social media and web pages?

References

Bolter, J. D. (2010). The breakout of the visual. In Writing space: Computers, hypertext, and the remediation of print (pp. 47-76). Routledge.

Task 5: Twine Task

For this assignment, I am wearing my BCIT hat and submitting a game where the nurse has to manage four different cardiac arrest scenarios. I used Twine 2.3.16 to create this game, which has proved to be a labor of love as I navigated the world of HTML coding. Had I come into this activity with prerequisite knowledge of this ‘machine language’, the process would have been a lot smoother and the learning curve less steep.

My initial concern with using this platform for creating a game was that the media is very text heavy. When learners are faced with a wall of text that lacks visual points of interest, attention can be lost. With searching chat forums and the internet, I was able to find codes that would allow better integration of multimedia. Through this, I was able to create a game environment that closer reflects a hospital setting and is more engaging through sounds and images. This first iteration of the game is basic at best and I will be taking this back to my colleagues for further revisions.

I find the language of computers as it compares to the language of humans fascinating. Both forms of language are structured with semantics and syntax, with machine language diverging from human language in its logic, precision and lack of intonation and emotion. The HTML coding in Twine needs to be exact for the computer to understand the directions and execute the command. There is no room for error. Whereas human language is flexible enough to still be understood if a mistake is made while conversing.

The linking text within this game services as a form of circular links which allow the individual playing the game to return to previous scenarios if they incorrectly answer the question (Bolter, 2001). This way, they are given unlimited attempts to examine the information on the page and test their knowledge. Additionally, these “hot” (Bolter, 2001, p. 27) texts show the player relationships between the content and the answers they have to choose from. They also act as a guide for progressing through the game, highlighting a pathway through virtual content (Bolter, 2001). From a design perspective, the onus was on me to ensure this virtual pathway through my game space was well planned out. This was more challenging of a task than I anticipated. When creating links between story passages that were bidirectional, I had to ensure that the “arrival” and “departure” (Landow, 1989 as cited by Bolter, 2001, P. 37) information of each passage represented logical relationships depending on how the player arrived at that destination. One of the limitations of this platform is the inability to link to content outside of the game for purposes of individual study or expanding on the concepts encountered in the game.

Below is my hyperlinked text to take you to the game! Enjoy!

https://wheebee.itch.io/cardiac-arrest-management-scenarios

References

Bolter, Jay David. (2001). Writing space: Computers, hypertext, and the remediation of print [2nd edition]. Mahwah, NJ: Lawrence Erlbaum.

ADDENDUM: Here are some screen shots of the game’s story line and some of the coding for the effects. The videos were created with our SIM software.


Task 4: The Mechanization of Writing

For this assignment, I wanted to take a deeper dive into the mechanization of writing with an application of the material to the context of my work. In order to do this, I opted to omit the content from the handwritten task to prevent this post from being lengthy. Instead, I will share my insights from the task.

For the medium, I chose to use a pen and paper. If a mistake is made during manual writing, I have to cross out the word and then rewrite it, or attempt to change the appearance of a misplaced letter. Using a pen prevents me from removing this error from my work. In lieu of this, to prevent an excerpt from having many errors, it should be well thought out and planned. Multiple errors will make the text difficult to follow thus challenging to read. It also poses challenges to eloquently portraying thoughts and ideas, as writing is typically a process that requires many revisions until you get it just right. Had I used a pencil instead of a pen, I could have erased errors ensuring an aesthetically pleasing final product. The other noticeable divergence from using a computer to manually creating text was the inability to use spell check. This latter issue would add to Plato’s argument that writing, in the context of the evolution of text technologies, can foster forgetfulness (Haas, 2013).

Haas (2013) and Bolter (2001) bring forth meaningful debate regarding the mechanization of writing which fostered a deep reflection surrounding the work I am currently involved with. As new technologies emerge, healthcare systems shift to adopt newer, more mechanized forms of writing in the hopes to remediate manual forms of writing for the purposes of saving money and providing safer patient care (Bolter, 2001). The work I am doing is involved with the development of electronic medical and health records so that hospitals can move away from being paper based.  Specifically, I am involved with developing and designing documentation templates that will be used by providers at acute care sites. This requires meeting with providers who have been appointed as subject matter experts (SMEs) for their departments to assess their documentation needs. Their feedback is then used to edit standard content provided by the vendor to suite the needs of these specialty areas.

Moving to a fully electronic system for documentation is going to cause significant shifts in the workflow for and the culture of providers at acute care sites. Currently, providers either document using a pen (that they likely stole from a nurse) and paper or via a dictation service they call into which generates a recording that is later transcribed by a human. If using the paper and pen method, they first need to locate the physical patient chart, tab to the section for doctor’s notes, and using a lined, 3-hole punched, piece of paper with patient specific identifiers in the heading, chart their assessment, findings and plan. Here is an example of their pen and paper documentation:

In future states, paper based documentation and transcription services will no longer be offered. Instead, they will be required to electronically chart, using a computer. That process requires them to locate a computer, log into their account, enter into the EMR system, select the patient’s electronic chart, then launch the documentation routine with the most appropriate document. Here is an example of what the electronic version of their charting will look like:

As you can hopefully see, electronic documentation separates out each section grouping information. Each of these sections then expands to reveal subsections with documentation fields.

All of these forms of text have a material essence to them both physically and psychologically (Haas, 2013). The process of providers documenting with either a pen and paper, or electronically, results in the production of material artifacts (health/medical records) which occupy space (Haas, 2013). Paper documentation is a space occupying material in the obvious sense that a piece of paper is physical, you can touch it, and add it to a patient’s chart. As more paper is added, the bigger the patient’s chart becomes. Electronic versions of documentation equally take up space via the computers they are created on and the servers information is stored on. From a psychological perspective, provider documentation has the ability to influence others. For example, medical records are utilized by other practitioners for the planning of patient care, for making in the moment healthcare decisions, and as an educational aide for students learning in the clinical setting.

The semiotic and material domain of provider documentation has the power to transform the future of health care (Haas, 2013). One of the ways this is accomplished is through the generation of health records (via provider documentation) producing vast amounts of healthcare related data. In fact, the generation of ‘Big Data’ from health records has given rise to the discipline of Health Informatics. The digitization of healthcare will have major implications both intellectually and economically. Large data sets extracted from health records can be used to train AI to perform computational tasks such as predictive modelling (searching for the next threat to public health) or to quickly and more accurately diagnose patients. This push to digitize and remediate the healthcare system shows the cultural importance these tools have in North American society. Haas (2013) would argue that this is a prime example of technological determinism.

Additionally, electronic health records are more readily and easily mined for data by computers than are paper charts a human needs to page through. The information that can be extracted from these electronic records can also be utilized for research purposes. Lastly, it provides ease of access to patient health care records so that the care patients receive is individualized and safe, reducing errors and improving patient outcomes. While this is not an exhaustive list of the benefits afforded by the mechanization of physician documentation, it highlights the motivational factors pushing for this change.

References

Bolter, Jay David. (2001). Writing space: Computers, hypertext, and the remediation of print [2nd edition]. Mahwah, NJ: Lawrence Erlbaum.

Haas, C. (2013). “The Technology Question.” In Writing technology: Studies on the materiality of literacy. Routledge. (pp. 3-23).

Task 1: What’s In Your Bag?

Hello everyone,

My name is Jessica Presta and I have included two pictures to help you get to know me. The first picture is of the contents of my work bag. The second picture is of me in the SIM lab at British Columbia Institute of Technology (BCIT)! Not to worry, that is not a real newborn!

The items in my work bag include:

  • Thinkpad laptop – corporate (BCIT)
  • Dell laptop – corporate (Fraser Health Authority, FHA)
  • Smart phone – personal
  • Smart phone – corporate (FHA)
  • iPad – corporate (BCIT)
  • Surgical mask
  • BCIT ID
  • Fraser Health ID
  • Headphones
  • Lineige lip mask
  • Glasses
  • Coffee mug
  • Car keys in the pocket

As you can see, the contents of my bag speak loudly to my current working situation. I will elaborate. I am a critical care nurse by trade and I have worked in the Intensive Care Unit (ICU) for 10 years. After a decade at the bedside I decided to pursue a career in education, working as faculty in the Critical Care Nursing Program at BCIT. I started this role back in 2019 and fell in love with education which was what motivated me to take the MET. This program has been wonderful and I am grateful for the people I am meeting and the learning it affords me. In February of this year, an opportunity to develop Fraser Health’s electronic healthcare records arose (moving us away from a paper based system of ‘text’ to a digital one), so I applied and was hired onto the team. I work closely with subject matter experts as a clinical practice consultant developing and building the system for use by providers and other healthcare workers. My role with FHA is full time and I am continuing to work for BCIT in a part-time capacity, overseeing the delivery of our program on Vancouver Island. I mostly work from home, however if I need to be onsite for whatever reason, I am required to bring these digital text items with me so that I can conveniently and efficiently access BCIT or FHA related information, emails, etc.  Additionally, all of these devices double as materials I use for completing course work for my MET. This term I also decided to take on two courses! So your well wishes are much appreciated.

The other items are more self explanatory. Coffee is an absolute must, every day. It is what keeps me going. I also cannot leave home without my lip gloss! The surgical mask is required when doing hospital/site visits, along with my ID’s. These give me access to various facilities. Last are my headphones. These can be used if I have to be in a virtual meeting when I am in an office/public space, or when listening to music while studying/working. Music is another form of text that I enjoy.

It is fascinating to think about these items in the context of ‘text technologies’ and how they enable me to engage with language while providing a portable means of communication. I think the concept of portability is what strikes me the most. There is this notion of immediacy, an expectation of being able to reach me anytime throughout the day. A feeling of always being plugged in because I always have these devices in arms reach, no matter where I go. It has led to increasing amounts of multitasking, emailing, and virtual meetings. Some days it feels like I need to be available in person and virtually at the same time.

The other connection I made was to the amount of technology I carry around, the resources required to create these devices, and how five to ten years ago, my bag would have been full of papers. When I first started transitioning away from paper based text to digital forms of text, I felt proud of myself for being more conscientious of the trees. Now, I realize that the data being stored on my various devices requires incredible amounts of energy and however many servers in order for me to have digital copies. I would argue that the latter may be worse.

Spam prevention powered by Akismet