(derived from week 3 course material)
Landscape ecology is a sub-discipline of ecology in which the interaction between spatial pattern and ecological process is the main study interest. This field of studies has been fueled by the urgent need to assess the impact of the rapid-changing environment. One of the commonly used methodologies in this field is quantifying landscape patterns using Fragstats, a spatial statistic software. In Fragstats, spatial patterns are quantified by a number of metrics, such as:
- Relative richness–the proportion of the number of cover types potentially present (e.g., based on the past or other landscapes).
- Dominance–the deviation from the maximum possible evenness.
- Diversity—a reflection of richness and how evenly the proportions of cover types are distributed.
- Connectivity–based on a user-defined threshold, a measure of how connected the patches are (think of movements between two patches).
- Probabilities of adjacency–the probability that a grid cell of cover type iis adjacent to cover type j.
- Contagion–distinguishes between overall landscape patterns that are clumped or rather dissected.
- Connectivity–how fragmented is a habitat type. Proximity index–the degree to which patches in the landscape are isolated from other patches of the same cover type.
- Area-weighted average patch size–to account for the frequently observed skewed distribution in patch sizes (e.g., many small, few large), use an area-weighted average to better reflect the probability of randomly selecting a patch.
- (see Fragstats’ help document for more metrics information and detail explanation.)
Application Example (Lab 2)
In this example, we will explore how the landscape around Edmonton, Alberta has changed over 1966 to 1976. Two digital maps (one for 1966 and the other for 1976) that contain land use data was downloaded from Canadian Land Use Monitoring Program (CLUMP). The digital maps that contain classified polygons were then converted to raster files with a resolution of 100m using ArcMap in order to produce inputs for Fragstats. Landscape metrics such as Patch Density and Shannon’s Diversity Index were computed using Fragstats. Also a transition matrix was created to show how the land uses are changed over time (e.g. from one class in 1966 to other classes in 1976).
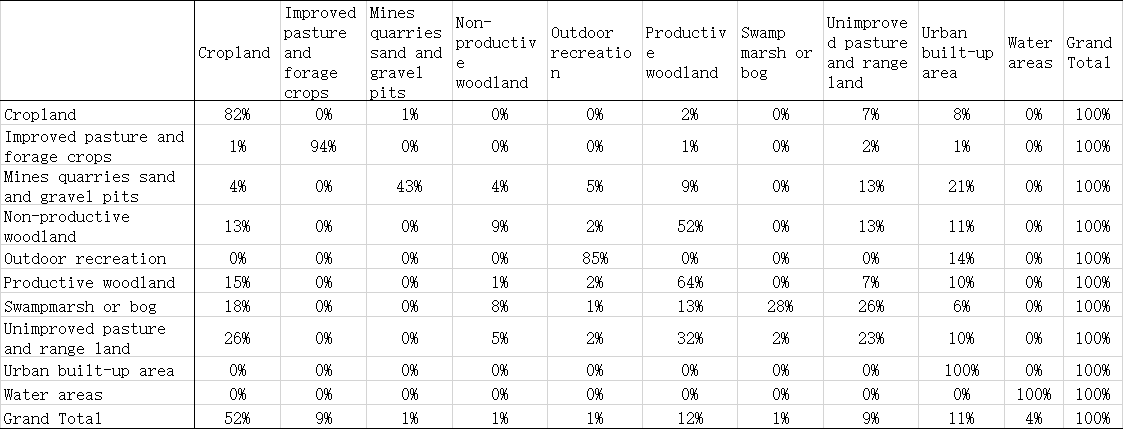
Transition matrix
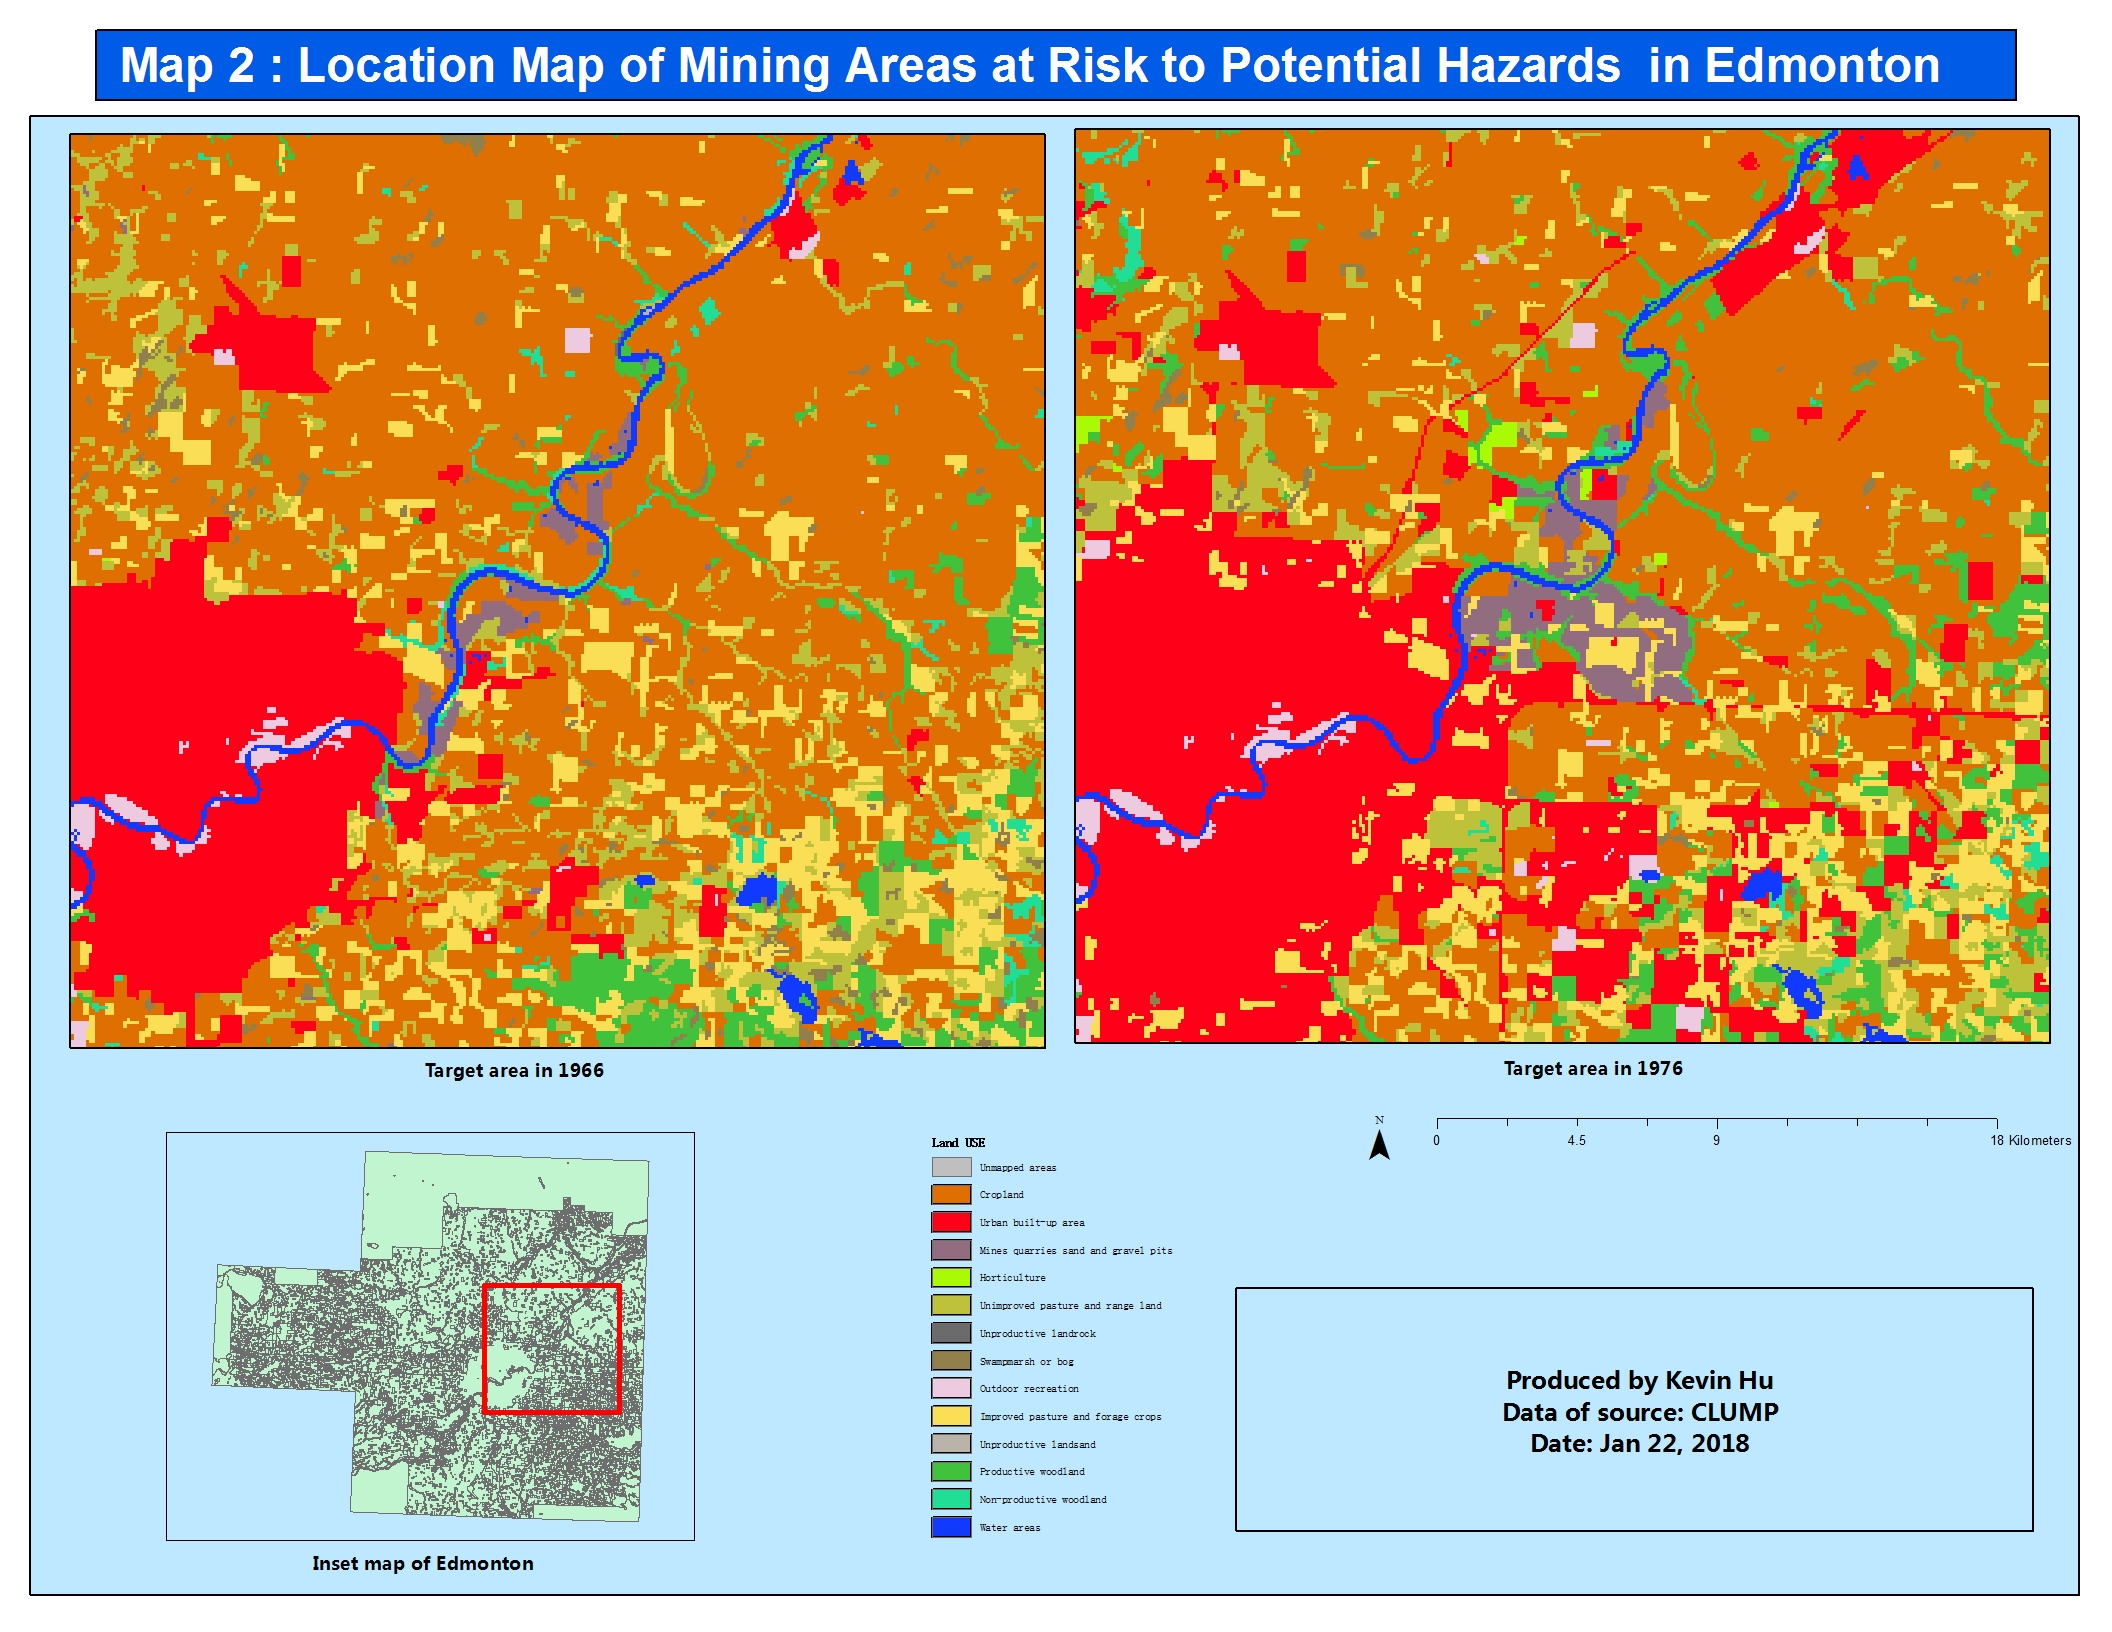
Comparison of land use change in the urban area
The results indicate that, due to construction booming in Edmonton in 1966-1976, land use pattern of the region had been significantly altered. Not only city center and suburban built-up areas were expanded, but logging and mining areas were also increased to supply constructions. However, these civil development were came from dramatic decrease in wilderness area as trade-off.
Sample Research Paper Review (Assignment 1)
[Abadie, J., Juliet Abadie, Jean-Luc Dupouey, Catherine Avon, & Xavier Rochel. (12/01/2017). Landscape ecology: Forest recovery since 1860 in a mediterranean region: Drivers and implications for land use and land cover spatial distribution
Springer.10.1007/s10980-017-0601-0]
This research investigates Europe’s Mediterranean region and the ongoing trend of forest recovery since 1860. The area of interest is Southern France, comprising mainly within the Provence-Alpes-Cote d’Azur, but extends around the coast to the Pyrenees and also including the island of Corsica. The research focused specifically on analyzing land use and land cover as a factor in assessing environmental changes. By using the biophysical and socioeconomic effects, the drivers were correlated to dependent variables such as forest cover, arable land and pastures.
In order to quantify the impact of biophysical and socioeconomic factors on land use change and forest recovery pattern, several attributes for each grid were calculated using spatial analyst tools. Biophysical factors such as elevation , topographic position index (TPI – indicates the relative elevation of a point to its surrounding environment) and slope were extracted from a digital elevation model (DEM) using Topography Toolbox in ArcGIS. The transition matrix method (presented as a diagram) was deployed by the author to show how a land use in 1860 changed over time. To address the question that how the biophysical and socioeconomic factors were contributed to create such changes, the author used logistic regressions method (aka., Exploratory Regression in ArcGIS) to fit models of LULC or forest recovery as a function of different factors in an additive equation. In addition, spatial autocorrelation was taken into account in the models by adding a function of UTM coordinates to the additive equation.
The result exhibits a trend which depicts an increase in land cover for both forests and built areas. The former grows over time, gaining land cover from other classifications, mainly from arable land and pastures. Built areas grow with increasing population, albeit the areas around the study sites were all only small villages, with most major population centers relegated away to the coast at Nice, Marseille, Montpellier and Monte-Carlo.
The research is done with good precision and accuracy, with a reliable back catalogue of historical data as the area has been populated for many millennia, although the authors does not hesitate to warn of the potential limited precision in historical georeferencing and questionable mapping units used in historical data, therefore urging future researches of the area to exercise caution when trusting this data.