(derived from week 6-7 lecture material)
Health geography (or medical geography) is an area of health study that is a cross-disciplinary field between medicine and geography which deals with the geographic aspects of health and health care. The main themes in health geography include: disease ecology, health care delivery, and the relation between environment and health. GIS plays an important role in this field because health and disease always have a spatial dimension, and they are affected by where people live. Major applications for GIS in health Geography are the following:
- Spatial epidemiology (describing and understanding spatial variation in disease risk)
- Environmental hazard monitoring and management
- Modeling health services
- Identifying health inequalities
In many of these applications, issues such as great uncertainty or dependence in data often occurred. Careful attention has to be paid to how the data is prepared for analysis (e.g., normalization by specific population groups), how the analysis is conducted (e.g., using the appropriate spatial and temporal approach), and how the results are interpreted (e.g., watching out for ecological fallacies).
Application Example (Dengue Fever tutorial)
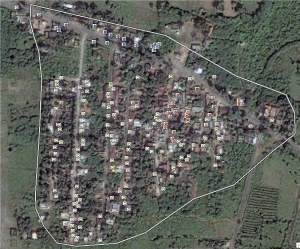
In this example, we will explore the spatial pattern of Dengue Fever in Pennathur, a village in Southern India. Dengue Fever is a painful, potentially fatal illness that is spread by a tiny mosquito, and unfortunately it is quite common in Southeast Asia and Central America. It is estimated that as many as 100 million people contract this disease each year. Hotspot analysis was performed using spatial statistic tools in ArcGIS. The result is showed in the figure below.
It can be observed that hot spots are clustered around a specific neighbourhood near the center of the map while cold spots are distributed along a road at the northwest corner. This suggests contracting Dengue fever is not a random event. Further studies are required to identify the factors that are contributing to the high rates of Dengue in the hot spot areas.
Sample Research Paper Review (Assignment 2)
[Rosero-Bixby, L. (2004). Spatial access to health care in Costa Rica and its equity: a GIS-based study. Social Science & Medicine, 58(7), 1271-1284. http://dx.doi.org/10.1016/s0277-9536(03)00322-8]
The research assesses the equity in access to health care in Costa Rica. This study assembles a geographic information system to relate the 2000 census population with an inventory of health facilities.
Firstly, the author evaluated the health care accessibility with a simple indicator of closeness of facilities to a given residential place. This was done by (1) calculating Euclidean distance between the centroid of each cell and the closest facility on the map. (2) Setting a threshold distance beyond which one can assume that population in the certain cell were not meeting their needs for health care. (3) Classifying the cells based on below or above the threshold distance. (4) The total population in cells above the threshold were identified as “underserved”. The result indicated 12-13% of the total population had unmet medical demand.
In densely populated areas, there are usually more than one facility around a cell. People not necessarily go to the nearest facility. They may go to a further one which is larger or less crowded. To account for this situations, the author develop a more complex index based on a discrete choice model that is well known in economy studies. The model assumes that people choose a facility after comparing characteristics of all possible choices. To determine how each characteristic affects the decision, the conditional logistic regression method was applied. This method is similar to exploratory regression but logistic regression is used when the dependent variable is categorical (e.g., in this case, yes or no for choosing a certain facility). The method identified that MD hours, distance, whether created in the 1990s and whether EBAIS is present are the most important variables that affect the probability whether an individual chooses a specific facility. The index of each cell is the sum of probabilities for all facilities within 25 km. This more complex model yielded a result as 12-14% of the population were “underserved”, which agreed with the Euclidean distance model.

