
(derived from week 1-2 course material)
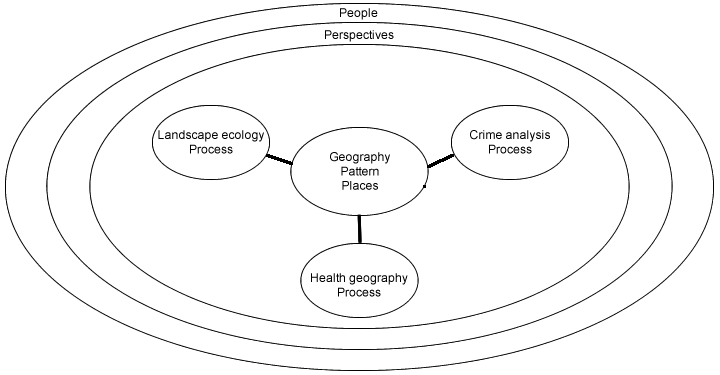
Geographical Information System (GIS) is a powerful tool in not only geography, but also multi-discipline researches. Many physical and social phenomena and processes are vary by space in nature, thus subject areas that study these phenomena or processes are connected by a common geographic component. This geographic component must be carefully considered in any study that uses spatial data, such as ecology, health geography and crime analysis. This component consists of the following perspectives:
- where do things happen (patterns)
- why do they happen at where they happened (processes)
- how does where things happen affect other things (context, environment) and how does context affect what happens (interactions)
- where should things be located (optimization)
The figure below is an illustration of how different subject areas are connected by geography and how different perspectives interact with others.
When exploring these perspectives, issues such as:
- the modifiable areal unit problem (MAUP, a.k.a., spatial resolution)
- the scale, grain and extent of a study,
- the nature of boundaries of a study area
- spatial dependence/heterogeneity (a.k.a., spatial autocorrelation)
are often encountered in researches. For example:
- Different statistical results can be obtained from the same set of data when the information is grouped at different levels of spatial resolution (the scale effect).
- Variability in statistical results is observed as a function of the various ways these units can be grouped at a given scale, and not as a result of the variation in the size of those areas (the aggregation or zoning effect).
- As different spatial arrangements of the same data produce different results, the statistical results are not independent of the areal arrangements. Therefore, it is difficult to isolate the effects of one from the other to generalized results.
Thus, choosing appropriate scale and minimum mapping unit is the key to obtain meaningful and relatively unbiased results in a spatial analysis.
The following pages will demonstrate applications of GIScience in ecology, health geography and crime with focus on exploring different geographic perspectives and addressing issues discussed above.
Application Example (Lab 1)
Mapping clusters is a commonly used method to discover spatial pattern in geographic data. Hotspot Analysis tells whether and where significant clusters exist. The map below is the hotspot analysis result for heart disease mortality rate in Southern United States in 2016.
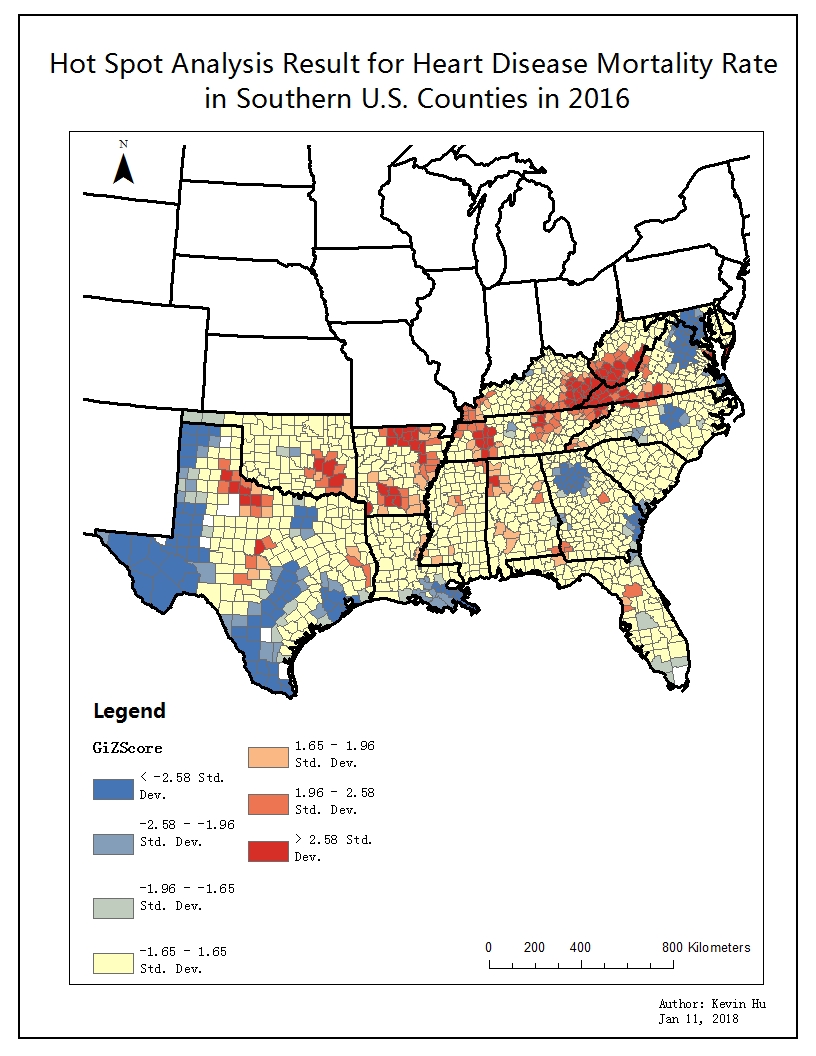
In this map, a county in red represents a statistically significant hot spot where a high value (heart disease mortality rate) is surrounded by neighbor counties with high values as well. In contrast, a county in blue represents a statistically significant cold spot where a low value is surrounded by neighbors with low value. On the other hand, no spatial clustering detected in yellow areas.
To create this map using ArcMap, heart disease data from 1999 to 2016 were downloaded from CDC Wonder(only 2016 data is displayed in this map), and Model Builder function was used to automate the process that import data of each year into individual feature classes . Hotspot Analysis tool (in conjunction with Model Builder for iteration) was then performed to general maps.
This pattern may relate to the topographic conditions of regions. Regions with high elevation tend to have high heart disease mortality rate as the largest hot spot (the intersection between Virginia, West Virginia and Kentucky) roughly fits in the Great Valley area.