
(derived from week 4 lecture material)
In modern scientific studies, statistic technique is probably one of the most important toolkits that a researcher should equip with. Statistics can be used to not only summarize data, but also to explore relations between variables. We can also make predictions or estimations based on the relations that we found. Commonly used statistical methods to look for relations between variables are correlation and regression. Regression is particularly useful for modelling numerical relations to make prediction or estimation. However, the traditional Ordinary Least Square (OLS) regression method does not take spatial variation into account, so it often performs poorly when there exists large spatial variation in the data (e.g., human behavior related data, census data).
Geographically Weighted Regression (GWR) is a relatively new spatial statistic technique that is improved from the traditional regression method. While the traditional regression assumes that the relationship we are modelling is constant over the entire dataset, GWR allows the target relationship vary over the study area. GWR treats each point and its closely surrounded points within a certain area as a unit. Instead of producing one equation that fits all data points, GWR outputs separate equation for each unit using regression. The shape and size of a unit are specified by the user depended on their interpretation on how close the points are clustered.
As GWR usually involves tremendous amount of calculation, it is implemented using specific spatial statistic software (e.g., ArcGIS). The output is usually mapped over the study area with color rendering to display the variation. Besides the predicted values (e.g., calculated Y variable), the output also includes measures of how good the model is, such as r2 and p values. By displaying these measures on the map, GWR provides an additional advantage over traditional regression in which the accuracy of the model can be assessed locally.
Application Example
In this example, we will explore the relation between a child’s social skills and a small set of variables related to the child and to their neighbourhood using both OLS and GWR methods. The dataset used is the 2001 Vancouver census data. First, the most important variables that affect a child’s social score were identified using the Explanatory Regression Analysis tool in ArcMap. Its output suggested gender, language skill and the average income in the neighbourhood have the highest impacts on child’s social score. Then, both OLS and GWR were performed using these three variables as independent variables and child’s social score as dependent variable. The result indicates the difference in performance between the GWR and OLS model is not significant in this study. However, the GWR model provides local diagnostic parameters which can be further investigated to make improvement.
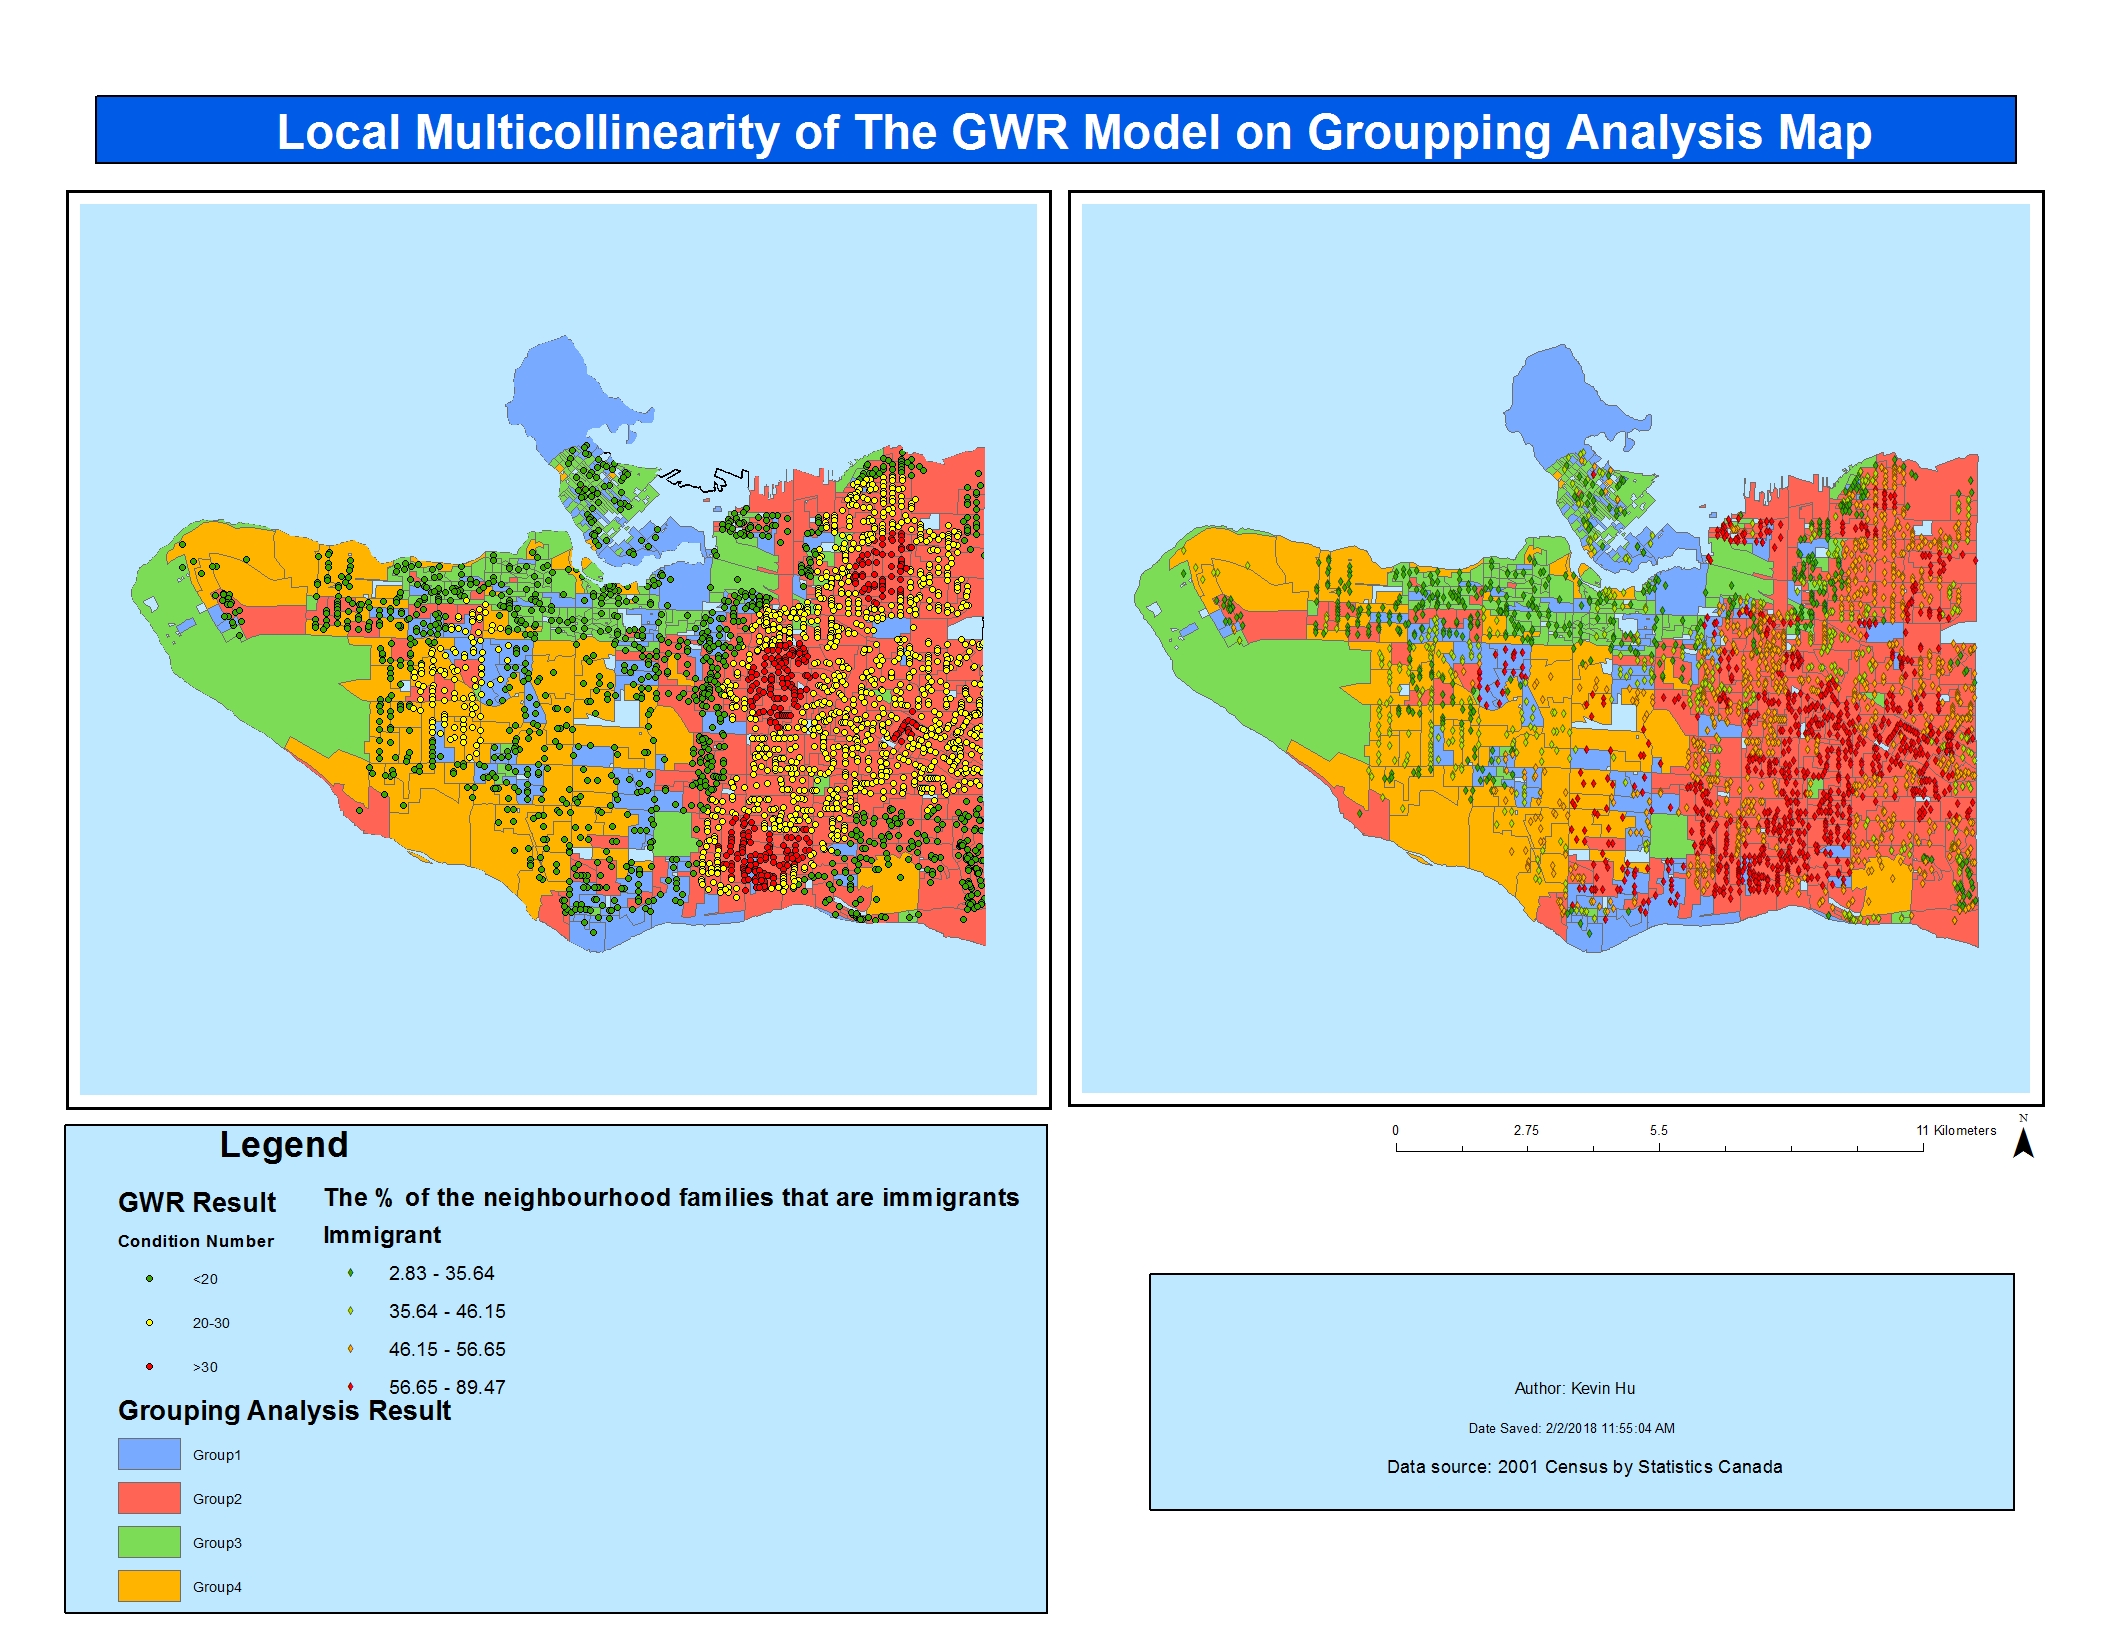
By exploring these local diagnostic parameters(e.g., multicollinearity), with the help of Grouping Analysis tool, we found that the GWR model can be further improved by including ‘immigrant’ as an explanatory variable.