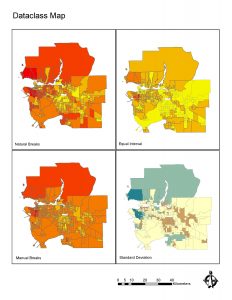
Data Interpretation and Visualization
As there are varying kinds of data interpretation, this affects the visualization process dramatically. This can be seen in the ‘Dataclass Map’ and ‘HousecostVO Map’ below.
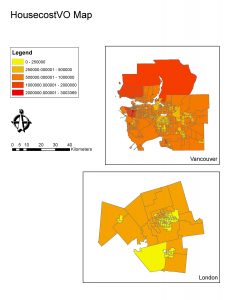
Housing Affordability in Vancouver, BC and London, Ontario
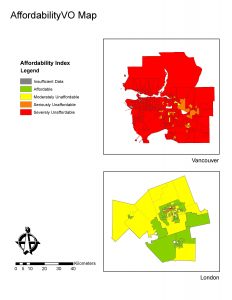
Affordability is measuring the relationship between housing cost and household income in the census tract, whereas housing cost is a singular analysis of this.
The categories for these rating categories are as follows: Insufficient Data, Affordable, Moderately Unaffordable, Seriously Unaffordable, and Severely Unaffordable. These were determined by the state, and may be trustworthy, depending on the context in which this data is to be used.
Affordability is absolutely not equivalent to liveability, as it does not encompass the plethora of other aspects that contribute to a city’s liveability, like greenspace, access to basic necessities, climate, etc.
Accomplishment Statements
Used tabular census data with shapefiles to display numerical data and household income visually.