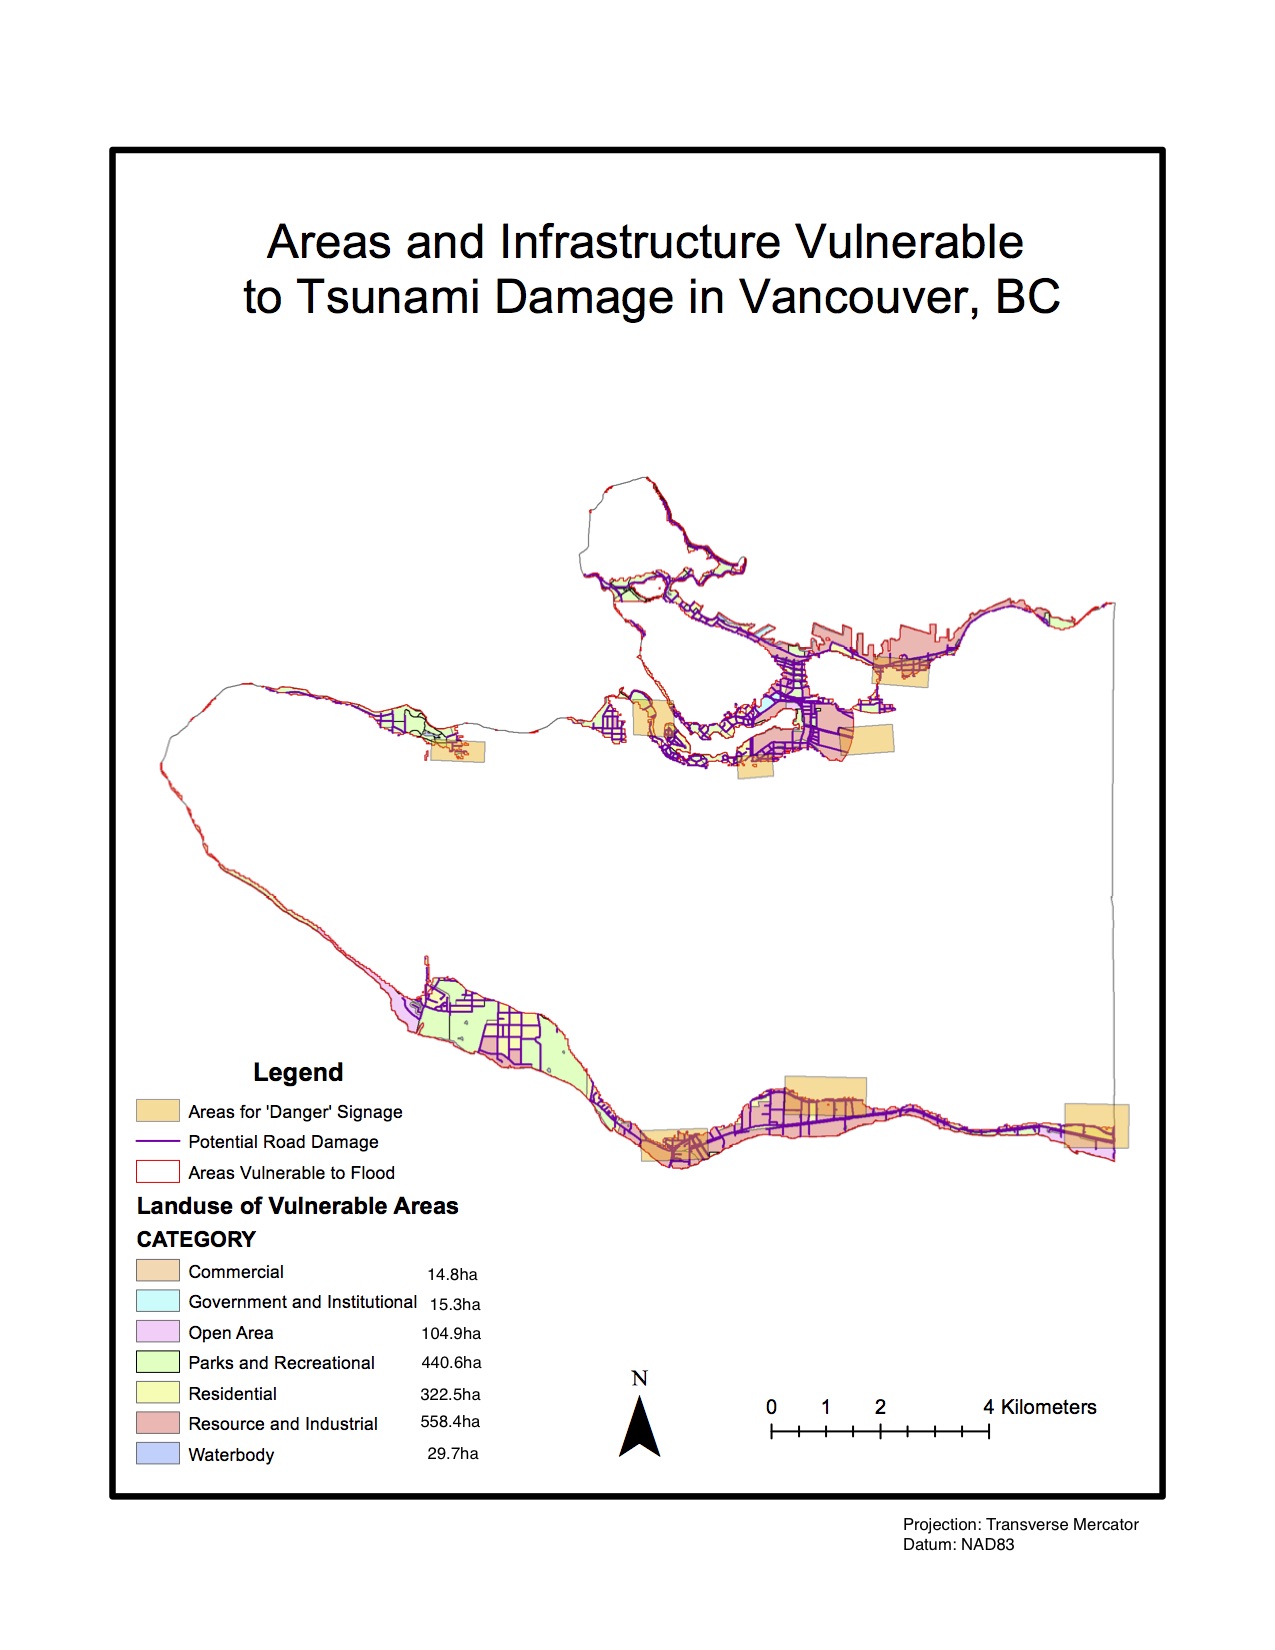
11.3% of Vancouver’s population is vulnerable to damage should flooding occur. To find this percentage, in the attribute table of the ‘vulnerable’ layer, I looked at the statistics of the ‘Shape_Area’ field and used sum to find the area in danger = 14862774.114046m2
I did the same process to find Vancouver’s total area: 131033339.950334m2
I divided the vulnerable area by total area and multiplied by 100 = 11.3%
Health facilities:
False Creek Residence
Villa Cathay Care Home
Broadway Pentecostal Lodge
Yaletown House Society
Education facilities:
Emily Carr Institute of Art & Design
Henry Hudson Elementary
False Creek Elementary
St. Anthony of Padua
Ecole Rose Des Vents
I used ‘Select by Location’ to locate the health and education facilities that were within the vulnerable area, and used ‘Export Data’ to create layers including each type of facility. I looked up the names of the facilities within the attribute table.