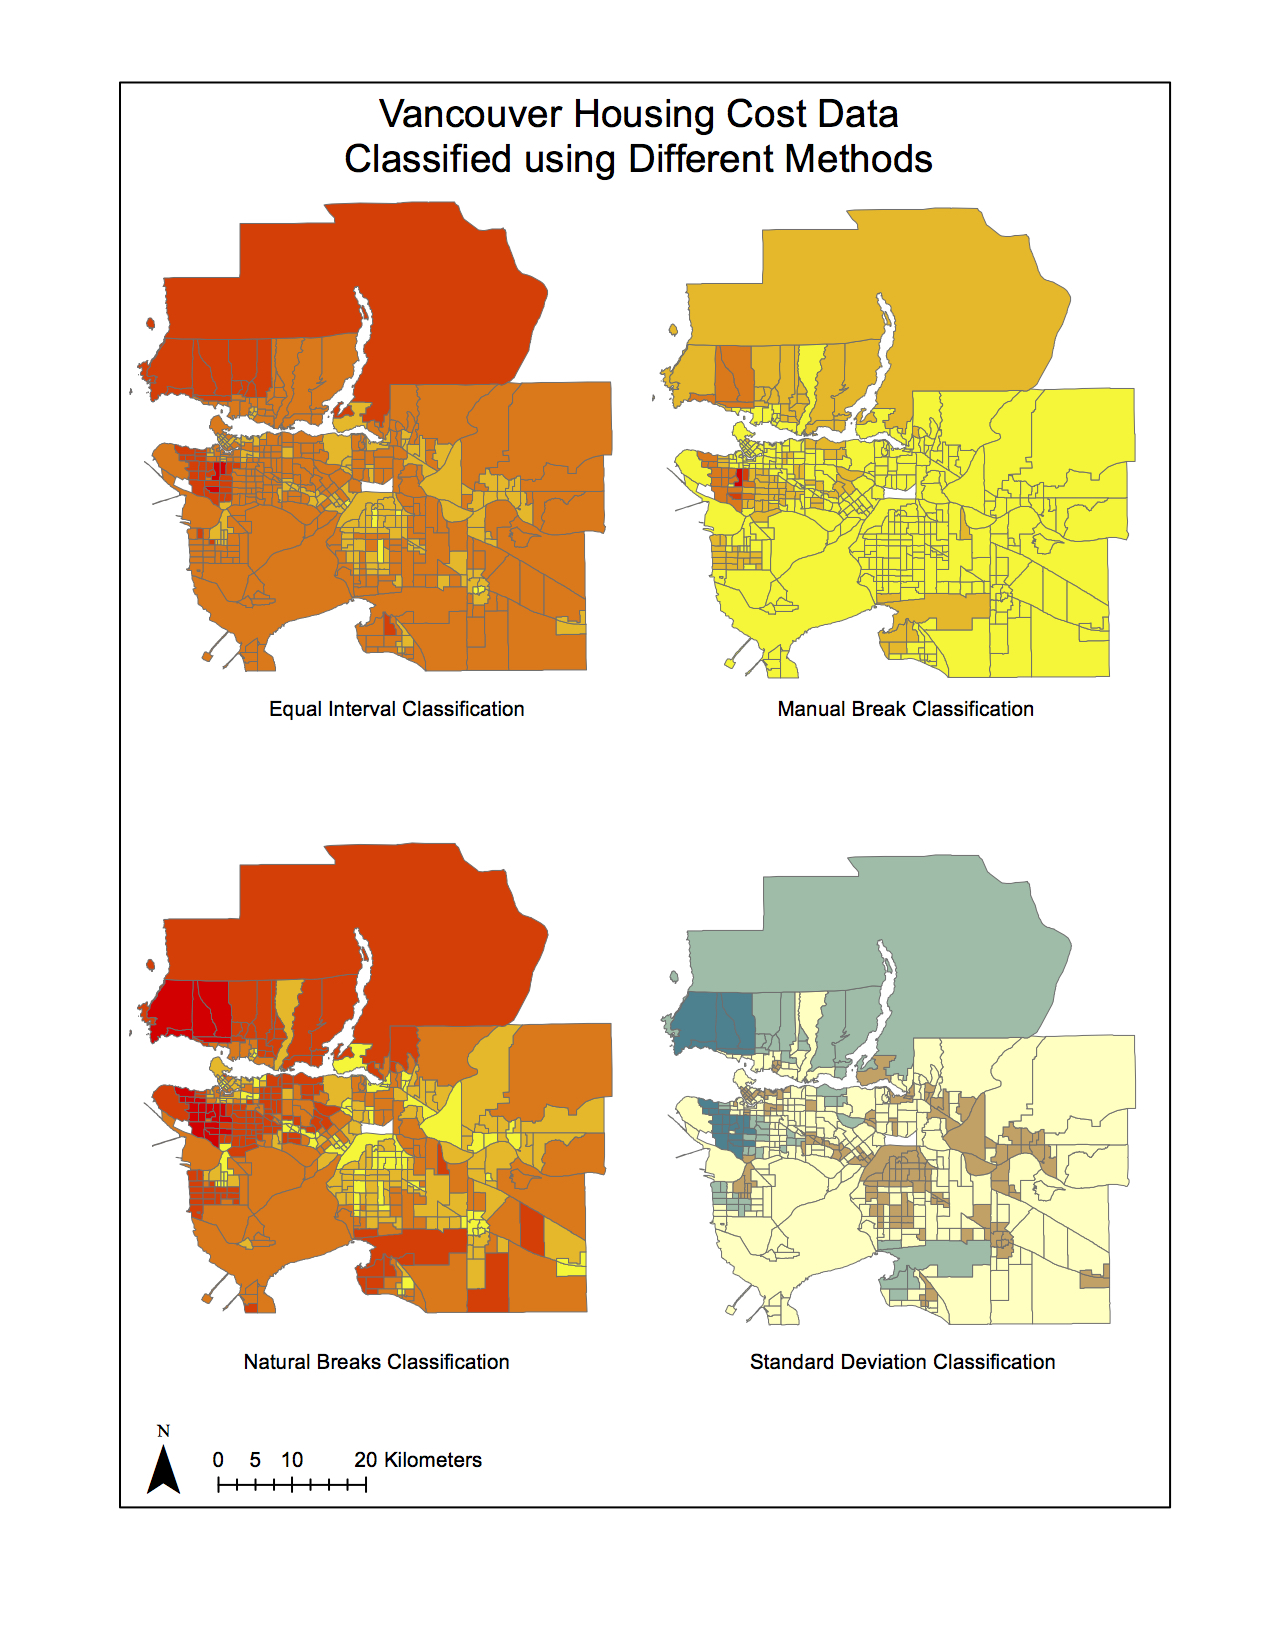
 If I were a journalist assembling these maps for a story on housing cost, I would probably choose the equal interval classification method, because it really looks the direst, and that might be a more interesting/outrageous story. It definitely depends on the angle I am going with for my story. If I were trying to argue that Vancouver should be considered less “liveable” I would certainly go with equal interval.
If I were a real estate agent, on the other hand, I would use the natural break classification method. Although housing prices around UBC look higher relative to other areas, it does appear that there is some relatively affordable housing, and the situation does not look quite so dire.
There are certainly ethical implications in choosing a classification method. Data interpretation and visualization is a very subjective process, and with that there is the potential to influence the data with personal biases, and often those biases are not necessarily clear to the person viewing the final product.