Although the Palladio visualization of the multiplex network created by the data gathered from the Golden Record Curation Assignment is unable to communicate the reason behind the choices that other students made, it leaves plenty of opportunity for speculation. Initially when presented with the data in this format I was at a loss as to what I was meant to be looking for and where to start. As I played with the settings and explored it further, I found myself naturally drawn to verifying if others had the same impulses I did in terms of which songs they kept and which they let go. I was particularly interested in looking at groupings of songs to see how many songs of a similar type, or from the same region people chose to include. When the data showed that others had made similar choices to my own it was easy to assume that they had done it for the same reason, but this would have been drawing conclusions based on pure speculation without supplementary data to back up what their intentions may have been. I visited several of my classmates webpages to try and ascertain why they made certain choices on the previous assignment and while some proved to be useful and went some way towards explaining the visualization of the data, most did not directly address the specific data points I was looking at.
Below is an image of the visualization showing the three tracks that originated in North America included on the Golden Record and the students who chose to include these on the record.
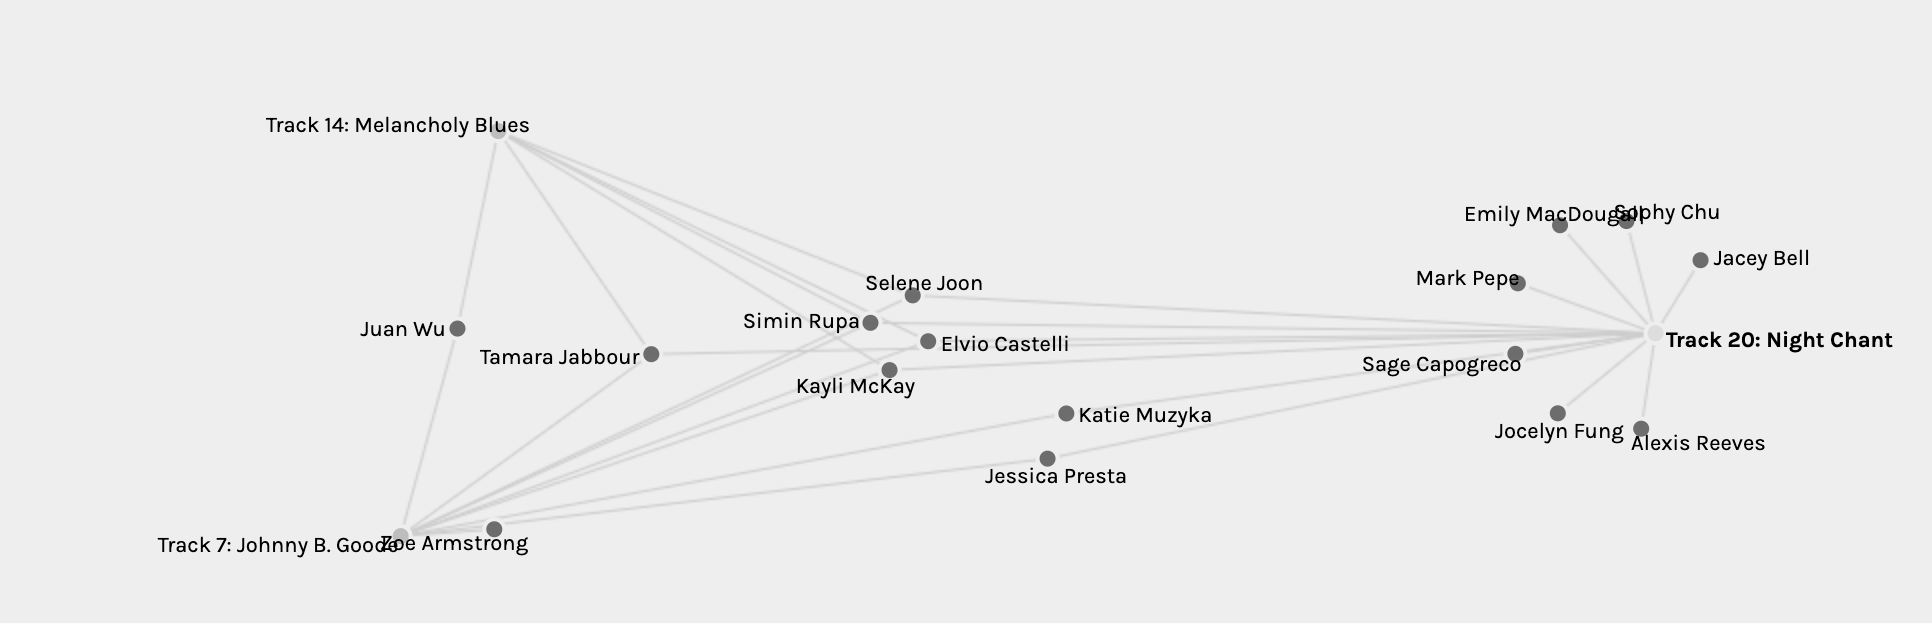
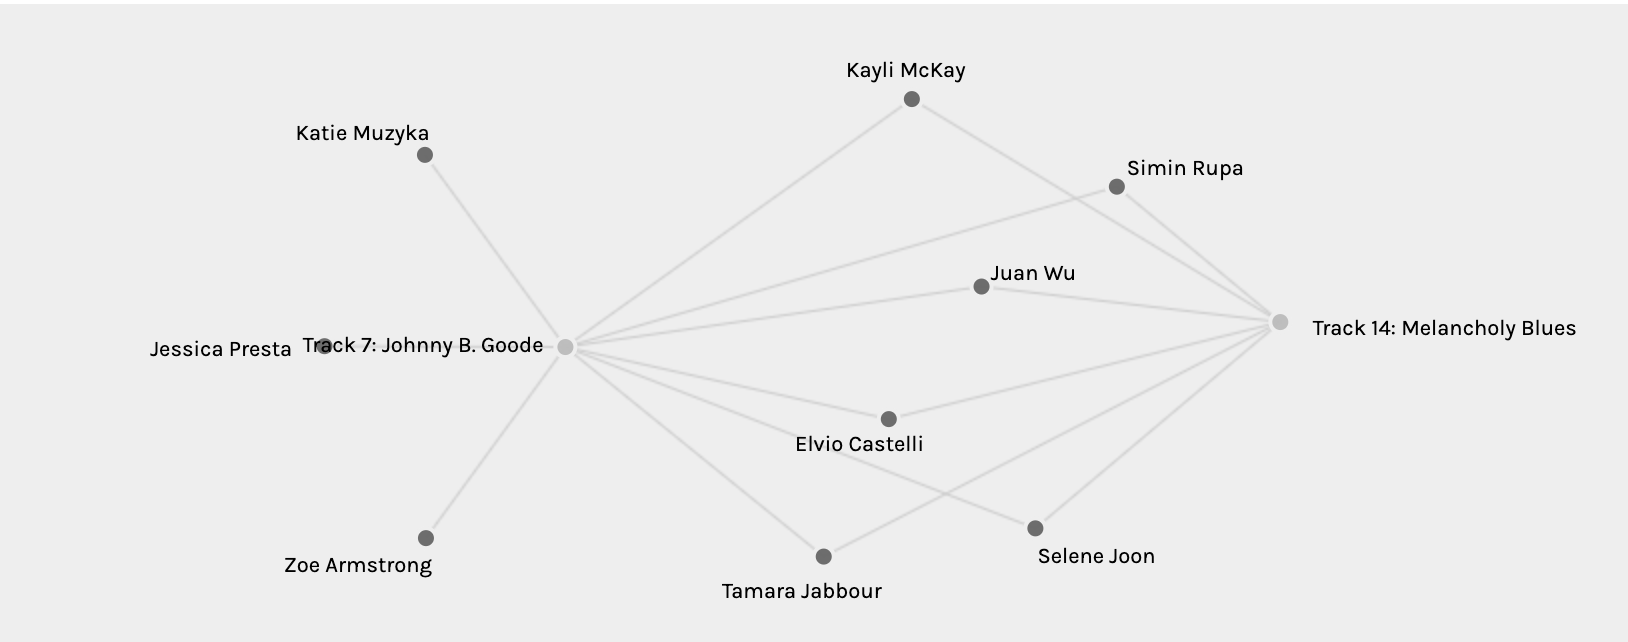
The first thing I noticed was that, with one exception, if a student chose to included “Melancholy Blues” or “Johnny B. Goode” in their list they also chose to include “Night Chant”. I would assume that this is because they did not feel that music in North America could be accurate represented without including an example of indigenous music. There were a number of students, however who only chose “Night Chant” and did not seem to think that other forms of North American music were necessary in representing that part of the world. It was also interesting to me that every person who chose to include “Melancholy Blues” also included “Johnny B. Goode”, although people who chose “Johnny B. Goode” did not all feel the need to include “Melancholy Blues”. This indicated to me that more people felt that “Johnny B. Goode” could act as a stand alone representation of North American music in a way that “Melancholy Blues” could not. The chart below shows the visualization that led to these assumptions about people’s intentions.
I am drawing assumptions based on data that may or may not represent the reasoning behind how every student made their song choices. Even though this has no guarantee of accuracy researchers, pollsters and others looking to interpret data for a number of reasons need to be able to draw conclusions about general intentions using data that does not include further interviews as a part of its collection. Although a visualization such as the one above would likely be much more confusing to interpret with more data points, having more participants would actually have been more revealing in terms of highlighting trends in people’s choices and would have allowed me to draw more conclusions as to possible reasons for these decisions.
I believe that null choices are remarkably well reflected by the visualization of the data if you put certain parameters in place and carefully choose what data you are looking at and for what purpose. When looking at the visualization, seeing edges coming off of nodes representing songs that lead directly back to nodes with a student’s name and not to the other track nodes makes a powerful statement about what those individuals prioritized. For example, in the first image of the visualization that I included in my reflection there are a number of students who only chose “Night Chant” out of the three songs included in the visualization. This makes a very strong statement about what they placed value on when completing the activity, as they did not choose two much more broadly recognized tracks by internationally recognized artists in favour of an indigenous track. Based on seeing what they did not choose I can draw conclusions as to why they may have prioritized “Night Chant” over a rock and roll or jazz piece.
In a way, the process of choosing parameters for the multiplex network visualization was not unlike using algorithms on google to narrow down a vast amount on information to only that which would be useful to answer a specific question. The visualization as a whole was far too vast, and even with the limited number of participants, too cluttered to make sense out of it without limiting what was being shown. I could only find exactly what I thought to look for based on the way that I manually restricted the data and it made me wonder how more complicated algorithms or AI might have been able to isolate data that I hadn’t thought to address in this complex web. When looking at a vast number of data points, computers are far more adept than human beings at identifying patterns and highlighting which may be of interest, even while humans are essential for the final interpretation of the data being highlighted.
If data from political surveys is analyzed in a similar way, having data with little context could lead to certain assumptions about why a person may have answered questions in a certain way, despite the fact that there could be many possible reasons for their answers. This could lead to candidates declaring a particular stance but for reasons that their electorate can not necessarily relate to. If voters are grouped in a similar manner using collected data it presents a rather homogenous group that all seem to share the same goals, but the reasons behind those remains largely obscured. Because data is typically interpreted with a specific question in mind, many of the nuances behind why someone may have answered a set of questions in a certain way are obscured in order to focus on what generalizations can be made about the group as a whole.
References:
Code.org. (2017, June 13). The Internet: How Search Works. Retrieved from https://youtu. be/LVV_93mBfSU