
Golden Record Data Set Analysis:
The visual representation of the data set created in Palladio offers up some insights into the connectivity of choices made by students in our class. In the data set below, you can see my choices as well as the two students with which I had the most overlap with.
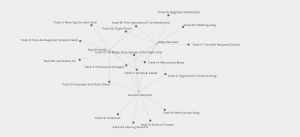
The data visualization reveals that Robyn, Duncan and myself have 4 overlapping songs, and that I had an additional overlap of 2 songs with Robyn and 1 with Duncan, so 60% and 50% respectively. While the Palladio program was able to group students according to the connectivity of their choices, it fails to offer up any additional data that would be pertinent to offer up a deeper analysis.
Some examples of missing information that may have impacted peoples musical choices are: age, gender identity, race, cultural background, musical taste, languages spoken, and geographical location. Without these pieces of distinguishing information, it’s difficult to discern what the members of my group actually have in common, and why we might have made our choices. The palladio program offers up a quantitative mapping of connectivity, but lacks any qualitative data that would allow us to make meaning of these nodes.
Also lacking from the data set are all of the null choices, which is a much larger group of songs than the choices that were selected. It would be interesting to see which songs were most frequently not chosen, and what those songs might have in common. For example, is there a particular genre that is often left out, or style of music (instrumental etc.) that led people to deselect it more frequently? Within my group, the program was able to offer up the songs that we did not have in common, but as with the connected nodes, it is difficult to make any meaning of the null choices, particularly as they are all different. Sociocultural factors have a huge impact on how we engage with the world, and without any data on who the people are behind the dataset, the analysis of these musical choices falls flat.
References:
Systems Innovation. (2015, April 18). Graph theory overview. [Video]. YouTube.
Systems Innovation. (2015, April 19). Network connections. [Video]. YouTube.